


CRUDE OIL PRICE WEEKLY TECHNICAL OUTLOOK
- Crude oil whipsawed over the last 5 trading days as prices coil between technical support and resistance levels
- Oil prices could continue to rebound from the steep slide recorded earlier this month but must first overcome a major level of confluence
- Download the free DailyFX Q3 Crude Oil Price Forecast for comprehensive technical and fundamental outlook
Crude oil prices closed flat last week after fluctuating 4% between key areas of technical confluence while traders struggle to determine the commodity’s next direction. Crude oil prices have remained subdued since sliding nearly 10% earlier this month – the sharp selloff accelerated after a hard rejection at technical resistance we pointed out in our previous crude oil price technical outlook.
CRUDE OIL PRICE CHART: 2-HOUR TIME FRAME (JULY 10, 2019 TO JULY 26, 2019)
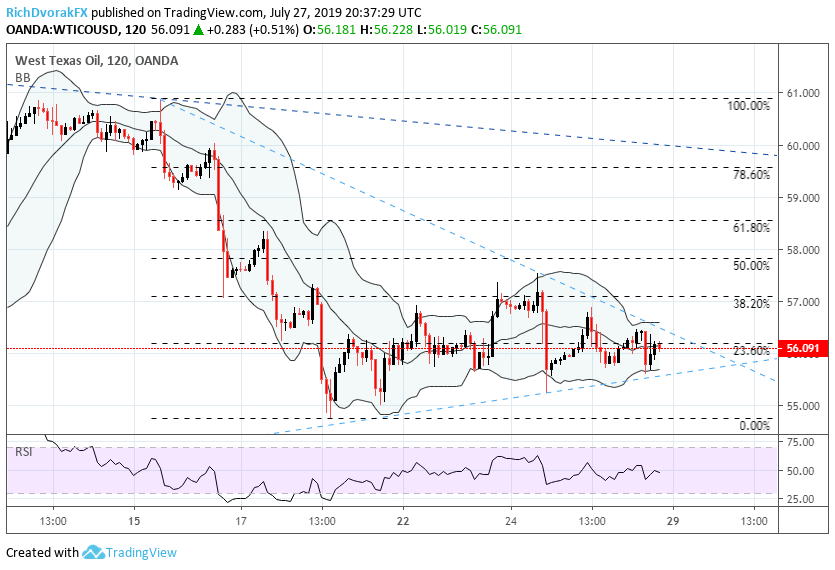
WTICOUSD chart created in TradingView
Despite the commodity attempting to claw back its string of losses over the last two weeks, crude oil price action has been relatively contained with WTI currently trading at $56.09. Yet, a short-term bullish trendline has begun to form as crude oil prices have recorded a string of higher lows since July 19 which could provide a degree of technical support going forward. Technicals appear damaged still, however, owing to the recent bit of aggressive selling. As such, several key resistance levels may keep bullish momentum at bay.
Check out these Crude Oil Trading Strategies and Tips for Insight on How to Trade Oil
CRUDE OIL PRICE CHART: DAILY TIME FRAME (NOVEMBER 29, 2018 TO JULY 26, 2019)
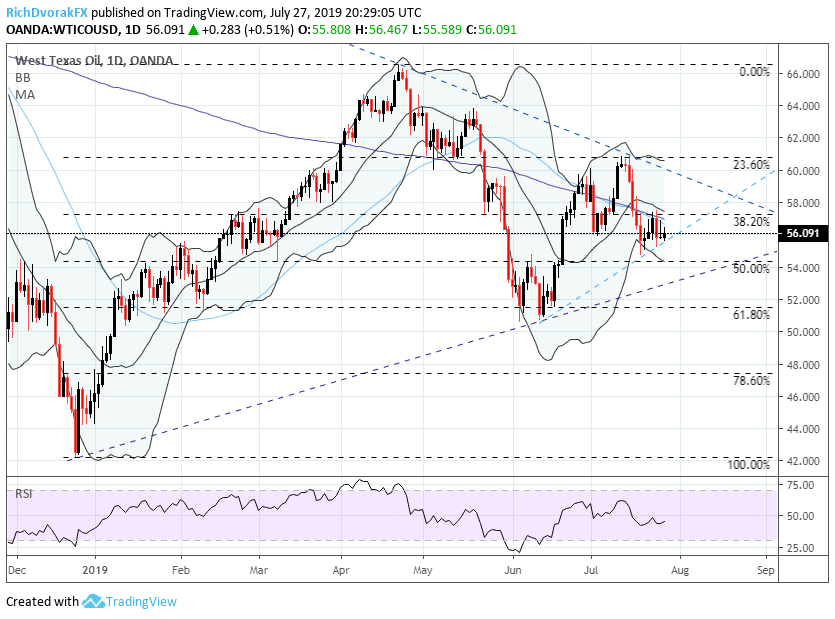
That said, bulls will look to eclipse the negative-sloping 20, 50 and 200-day simple moving averages in addition to technical resistance posed by Fibonacci retracement levels around $57.00-$57.50 headed into next week. Crude oil prices have consolidated around the current price zone previously this year, which could keep a lid on crude oil prices if the area of confluence prevents traders from pushing the commodity higher. Although, the previously mentioned short-term bullish trendline connecting the June 12 and July 24 intraday lows might propel crude oil prices higher.
Find out the Top Crude Oil Facts Every Trader Should Know
If price action can top $57.50 next week – the price level near the 38.2% Fibonacci retracement of crude oil’s sharp climb to $66.00 off its December 24 low – oil trader sentiment might start to shift back in favor of bulls. Evidence of bullish momentum returning to crude oil prices could be provided by the RSI reclaiming a reading above 50. If these technical objectives can be overcome, it will likely open up the door for crude oil prices to test bearish trendline resistance from the April 23 and July 11 intraday swing highs.
OIL PRICE VOLATILITY AND CRUDE OIL CHART: DAILY TIME FRAME (JANUARY 31, 2018 TO JULY 26, 2019)
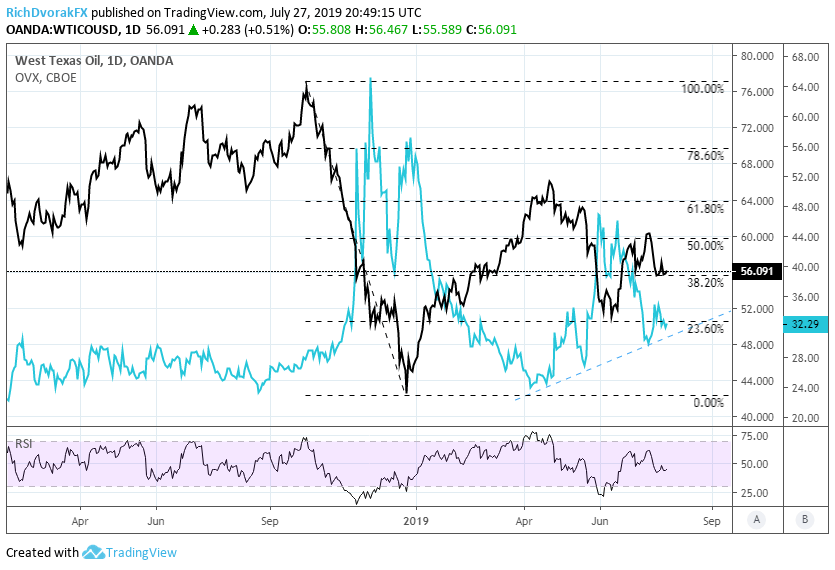
As for oil price volatility, a break below the uptrend line forming since April would be constructive for further advances in crude oil prices given their strong inverse relationship. The 38.2% Fibonacci retracement of the near-vertical drop in crude oil prices from October 2018 to December 2018 also highlights the major area of confluence around the current price level which could be solidified as support next week.
Conversely, another hard rejection at this key technical level remains a possibility.A push higher in oil volatility could serve as a bellwether indicating more downside in crude prices is likely. If WTI slips below this area alongside rising oil price volatility, crude oil bears could attempt to push the commodity toward the bottom printed last month around $51.00.
What is the difference between WTI and Brent Oil?
IG CLIENT SENTIMENT INDEX – CRUDE OIL PRICE CHART: DAILY TIME FRAME (JANUARY 28, 2019 TO JULY 26, 2019)

According to the latest IG Client Sentiment data, 66.6% of retail crude oil traders are net-long resulting in a long-to-short ratio of 1.99 to 1. Crude oil traders have remained net-long since July 12 despite prices sinking 6.9% lower since then. Although, changes in client positioning suggests that retail traders are growing less-optimistic over bullish crude oil price prospects seeing that the number of traders net-long is 2.7% higher than last week whereas the number of traders net-short is 14.0% higher than last week.
-- Written by Rich Dvorak, Junior Analyst for DailyFX.com
Connect with @RichDvorakFX on Twitter for real-time market insight


