


S&P 500, Dow Jones Analysis and News
- S&P 500 | Bearish Divergence Leaves Index Vulnerable
- Dow Jones | Showing Signs of Exhaustion
Source: Thomson Reuters, DailyFX
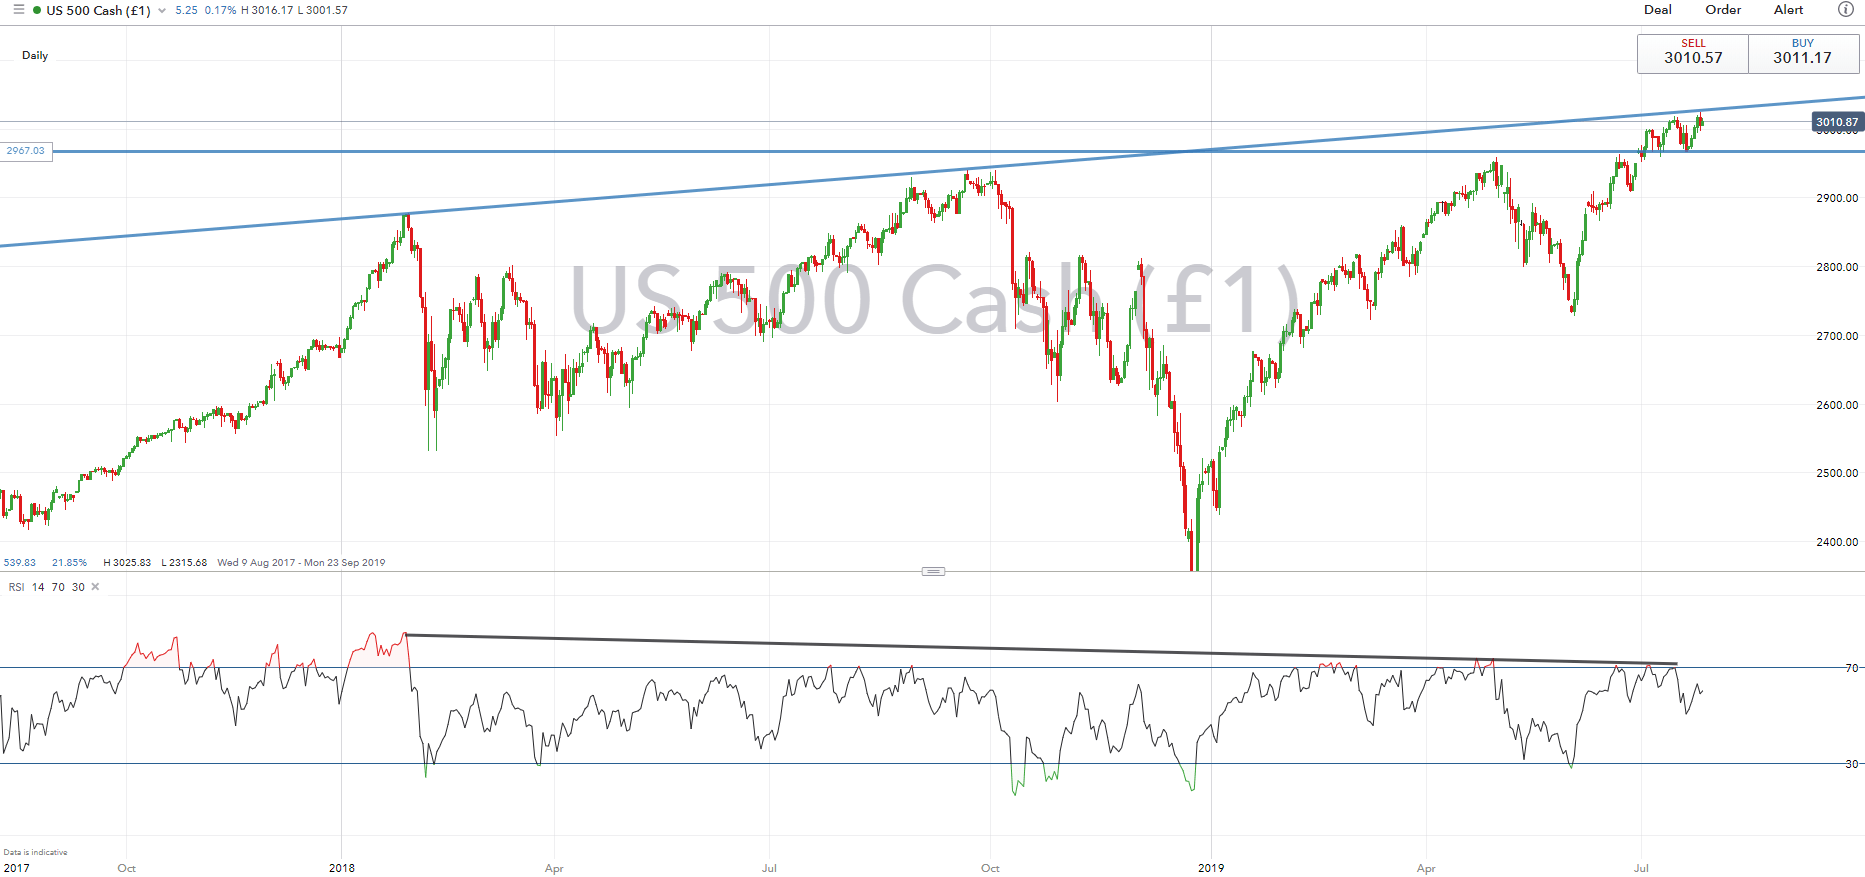
S&P 500 |The index has managed to consolidate above the psychological 3000 level following the bounce from support at 2960-65. However, further gains in the index have been curbed by the rising trendline stemming from prior record highs, thus leaving the index vulnerable to a pullback. Catalyst likely to stem from next week’s FOMC decision, particularly the Fed are less dovish than what the markets expect. The RSI on the daily time frame continues to show a bearish divergence, further adding to the view that upside momentum may be somewhat exhausted. The key support zone is situated at 2960-65, in which a break below paves the way for a 2900 test.
S&P Price Chart: Daily Time Frame (Aug 2017 – Jul 2019)
DJIA | The index is beginning to show signs of exhaustion with the RSI closing below 60 and hitting its lowest level in over a month. Eyes will be on the weekly close, in which a close below last week’s low (27,068) may confirm that a near-term top has been set for the index. In turn, this leaves the Dow Jones vulnerable to a move towards the 26,600-26,650 zone. As a reminder, the Fed rate decision and comments by Chair Powell will be key next week.
Dow Jones Price Chart: Daily Time Frame (Jan 2019 – Jul 2019)

RESOURCES FOR FOREX & CFD TRADERS
Whether you are a new or experienced trader, we have several resources available to help you; indicator for tracking trader sentiment, quarterly trading forecasts, analytical and educational webinars held daily, trading guides to help you improve trading performance, and one specifically for those who are new to forex.
--- Written by Justin McQueen, Market Analyst
To contact Justin, email him at Justin.mcqueen@ig.com
Follow Justin on Twitter @JMcQueenFX


