


Gold Technical Forecast: Bearish
- Gold prices trade cautiously lower as selloff may accelerate
- Bearish signals undermine the dominant XAU/USD uptrend
- IG Client Sentiment also offers gold bearish contrarian bias
Find out what the #1 mistake that traders make is and how you can fix it!
Gold prices traded cautiously lower this past week, making for the worst performance over the course of 5 days since the first week of July. While progress was very gradual, there were a couple of notable technical developments. Together, these threaten the precious metal’s rise going back to August 2018.
It began with a Bearish Engulfing on July 19, a candlestick that carries reversal implications given technical confirmation. One could look at gold’s decline as of late to cement this argument. This also occurred alongside negative RSI divergence, a sign of fading momentum to the upside which can at times precede a turn lower or result in consolidation.
However, I am also closely watching the break under a near-term rising support line going back to June on the first chart below. From here, further closes to the downside underpin these bearish technical signals. Together, these may pave the way for a test of 1392 – former high from March 2014 - before targeting the July 1 low at 1381. Beyond that is a range between 1357 and 1366.
On the other hand, should XAU/USD see buying pressure in the week ahead and take out immediate resistance at 1422 – the 23.6% Fibonacci extension – that may pave the way for a retest of the August 2013 high at 1433. Clearing that opens the door to refacing the 38.2% extension at 1447 which previously tamed the dominant uptrend.
Gold Daily Chart

Chart Created in TradingView
IG Client Sentiment: Gold
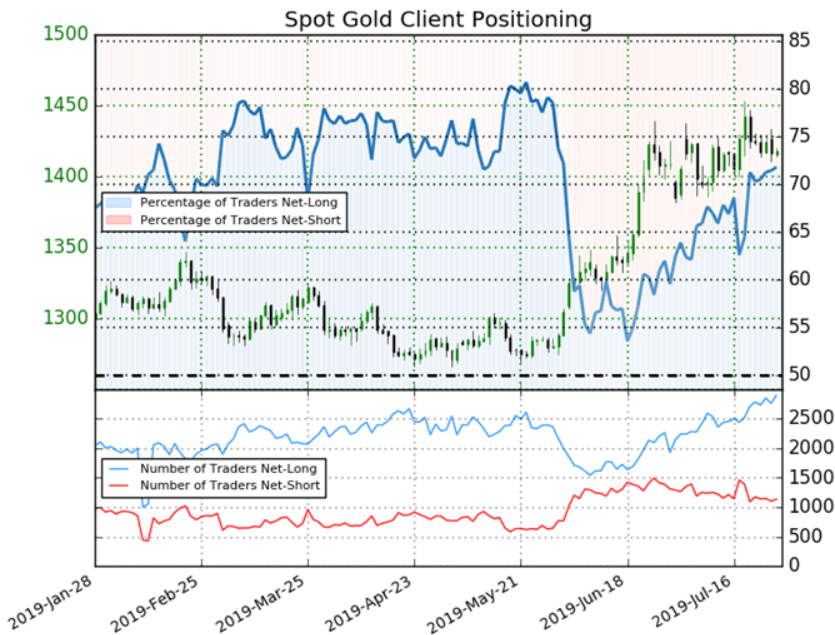
Meanwhile, the latest readings in IG Client Sentiment are offering a gold-bearish contrarian trading bias. About 71.8% of traders are net-long, 1.8% higher than yesterday and 17.7% from last week. Net-short positioning on the other hand is 3.4% smaller from yesterday and 19.4% lower than compared to the previous week.
To learn more about how to use sentiment in your own trading strategy , join me each week on Wednesday’s at 00:00 GMT as I uncover what IG Client Sentiment has to say about the prevailing trends in financial markets and follow me on Twitter here @ddubrovskyFX for timely updates!
Spot Gold Client Positioning
FX Trading Resources
- Having trouble with your strategy? Here’s the #1 mistake that traders make
- See how the Gold is viewed by the trading community at the DailyFX Sentiment Page
- Just getting started? See our beginners’ guide for FX traders
--- Written by Daniel Dubrovsky,Analyst for DailyFX.com
To contact Daniel, use the comments section below or @ddubrovskyFX on Twitter


