


Dollar Talking Points:
- The three-day tumble from the DXY after the Fed decision was the sharpest loss since Feb 15, 2018
- With last week’s move, a 13-month trend channel, the 200-day average and H&S neckline have broken
- See how retail traders are positioned in EURUSD, USDJPY and key Dollar based crosses along with oil, indices and important FX pairs in real time
Technical Forecast for Dollar: Bearish
There was little mistaking the Dollar’s abrupt change of both direction and pace this past week. From a sound bounce on a well-worn channel support that was flagging the further it climbed, the second half of the period capsized into an unrestrained tumble. It was further impossible to overlook the spark that led to the 180 in sentiment. The market read deeply into the Fed’s policy decision and forecasts to project its own collective outlook of an oncoming dovish wave that has also spurred a rush of moral hazard into speculative assets. To gauge the probability of follow through for trend development, it is critical that key technical levels fall. Yet, just as important to the drive are the systemic fundamental motivations and general nature of the markets. There is still far more congestion than there is progress across the global markets, so clear and decisive motivation is necessary to overcome inertia. Therefore, even technical traders should keep tabs on rate forecasts, recession fears, trade wars and general risk appetite. Thankfully, we can chart these considerations.
Starting with an overview of the Greenback as we enter the new trading week, the picture is clear as we see a confluence of developments. I am a firm believer in the self-fulfilling nature of technicals (and really all analysis techniques), so it is worth identifying the cues that the greatest overall number of traders would see. For the DXY trade-weighted Dollar index, that would be the 200-day moving average which gave way with Friday’s extension. The biggest three-day drop since February 15th 2018 was the kind of drive necessary to take out a floor of that girth. One step down from the ubiquity of the moving average was the rising channel that dates back to early May 2018 and notched many successful points of hold over the time frame. The third most recognizable – and therefore more likely overlooked – is the head-and-shoulders pattern that was triggered.
Chart of DXY Dollar Index with 200-day Moving Average (Daily)
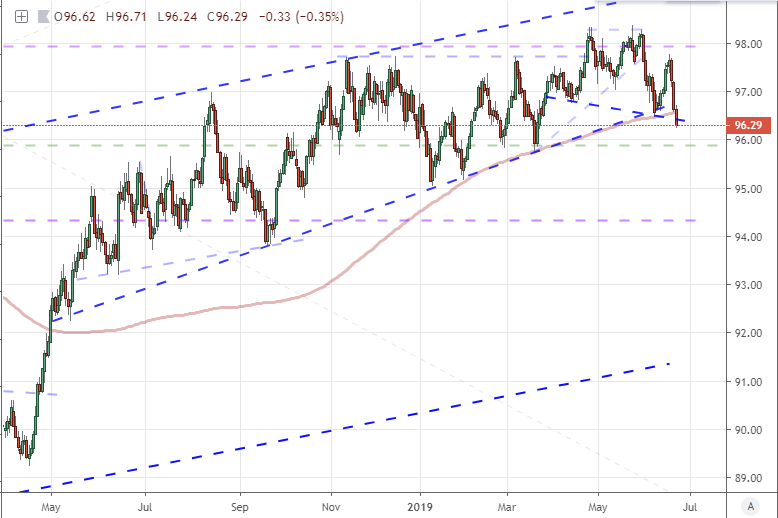
As far as head-and-shoulders go, there is often far too much influence afforded to the pattern. Given that it is not difficult to spot and they are usually associated with reversals, it is a natural favorite among any technicians. Yet, what we should appreciate is the natural implications that such outlines can convey. At its core, the series of a high, higher high and lower high is what one would expect in a turning tide. Of course, we need to ensure that the highs are substantial. The ‘neckline’ is the point at which momentum traders will pay attention, and a descending trendline suggests there is already movement towards shifting direction. The most important element of this pattern however is the preceding trend. If it is fundamentally a reversal signal, there needs to be something to reverse. There certainly was a bull trend in the Dollar over the past year, but its pace was very choppy. That will likely inspire a similar insipidness in any course correction unless further fuel is thrown onto the fire. In other words: the technical cue alone will not likely charge momentum.
Chart of the DXY Dollar Index (Daily)

To further appreciate the restraint that we are competing with on the Dollar forging any meaningful headway, we can look at the higher time frame chart. Below is the weekly DXY picture which puts into perspective the past 12 months a phase following clear trends and more productive range trading (2015-2017). I don’t show it in the chart below, but the 60-day (3 trading months) range that the currency had traversed through the open of this past week was the smallest as a percentage of the spot rate on record. It is fitting then that just this past week’s tumble alone was the biggest drop in 16 months and supported a notable technical breach.
Chart of DXY Dollar Index and 1-Day Rate of Change (1-Week)

The elements for a momentum shift to support a directional correction seem to be in place, but it is important to keep track of depth of conviction for such a tempest. Aside from the general restraint in the broader financial system, there is still technical restraint that can be found across the Dollar’s general landscape. De-emphasizing the EURUSD which accounts for the vast majority of the DXY’s pricing, we are left with the picture below. This is a synthetic that few (if any) people reference, but we can see its echo in many of the majors. Is there really enough momentum in the USD selling to drive GBPUSD, USDJPY or AUDUSD to extend their less-than-provocative charts to action?
Chart of Equally-Weighted Dollar Index with 200-Day Moving Average (Daily)
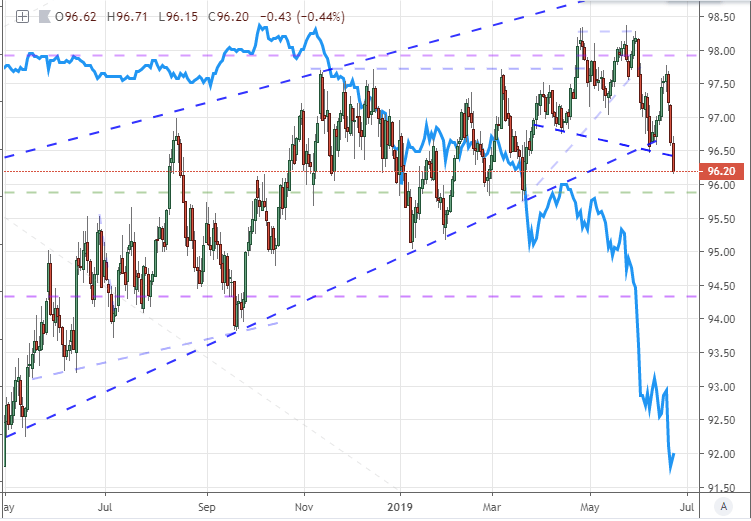
Without doubt, the primary driver for fundamental interest at the moment for the USD is the sharp drop in Fed rate forecasts. Below, we have the standard Dollar index again overlaid with the market’s implied degree of rate cuts through year-end derived from the December Fed Funds futures contract. Pricing in 70 basis points worth of cuts (nearly three standard moves), it is clear that there is a lot of pressure through this channel. As remarkable as that may be, however, not that the correlation only recently kicked in this month. Is this an awakening of appreciation or just a temporary link owing to its intensity? If the former, a trend is easier to develop while the latter would more likely lead to a stalled move.
Chart of DXY Dollar Index and Implied Yield from December Fed Funds Futures (Weekly)
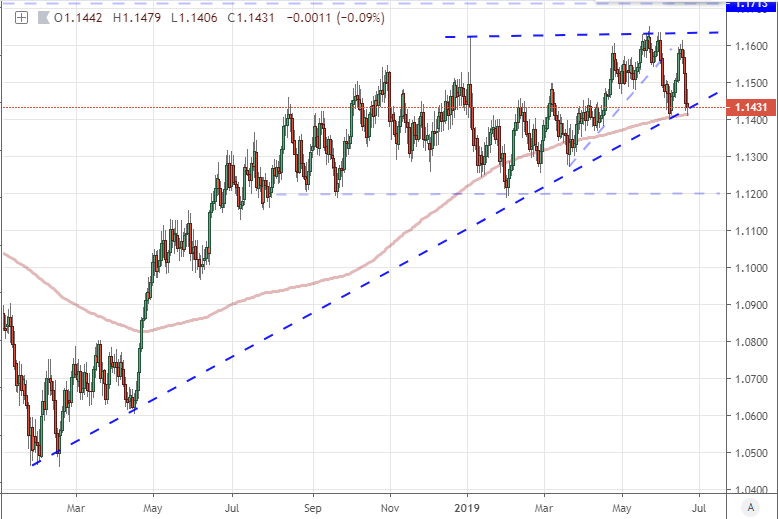
Looking across the majors, we can pick up on different aspects of the Dollar’s strengths and weaknesses which can follow fundamental tides. USDCNH for example is a good cue for trade war developments. As the pair fails, the Dollar’s general loss on a rebalancing away from ill-conceived isolationism strength plays out. Yet, while the EURUSD is a skewed measure, it is still the most important. No surprise, EURUSD is generally a mirror of DXY, though the channel break happened at the beginning of the month with this pair. The 200-day moving average clearance only occurred this past Friday though. If the Dollar is genuinely dropping, the world’s second most liquid currency will more likely absorb a disproportionate amount of the outflow.
Chart of EURUSD (Daily)

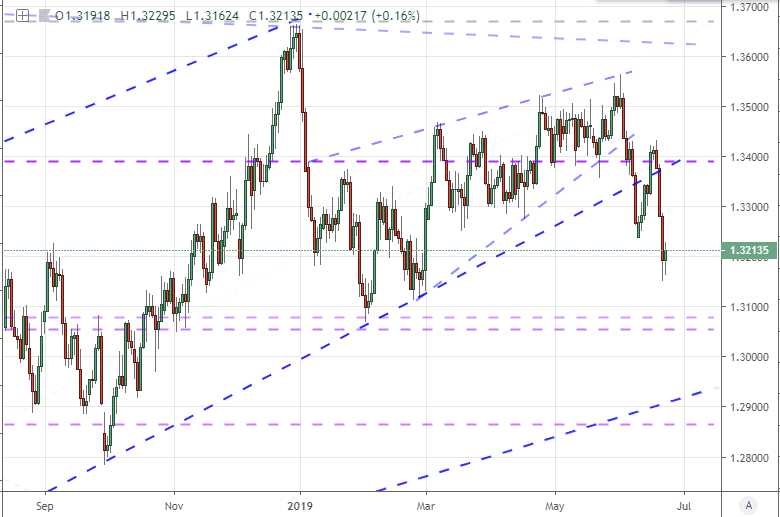
If you are looking for a Dollar outlet with less systemic overhead, USDCAD would be a good candidate. It has struggled more with range conditions than perhaps any other pairing with the exception of EURUSD, but it has a good fundamental curb on the number of outside catalysts for which we need to account. A sustained drop holds good technical milestones in a confluence of longer-term Fib levels around 1.3075/50 and a long-term trendline support is just above 1.2900. If the Dollar steadies, we move back up to the key levels established this past month. While it is not an epic range to project, it is far more reasonable given our general market condition and it encourages us to keep a reasonable interpretation of what is possible.
Chart of USDCAD (Daily)
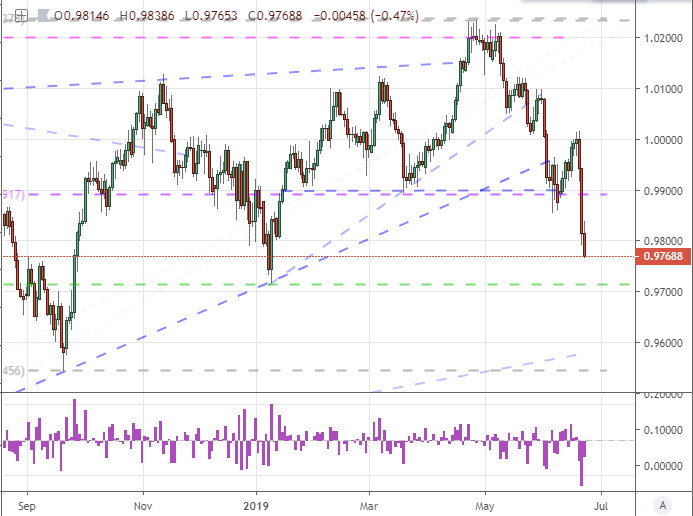
If the Dollar is genuinely due a bounce, a recovery will be difficult to muster serious pace. Though holding back a channel break is meaningful, it is still an environment just off the smallest historical range on record. Therefore, looking for a pair uniquely positioned for intensity, USDCHF may fit the bill. The Franc is lending its own influence to this performance with EURCHF marking a critical breakdown this past week. It is far from normal market development, but the Swiss National Bank has vowed to intervene on behalf of its currency to avoid economically-painful appreciation. While its direct target would be EURCHF and its effectiveness is questionable at best, it is nevertheless a potent potential force.
Chart of USDCHF and 1-Day Rate of Change (Daily)
As far as speculative positioning goes, there is no extreme wind up to project an easy coasting in reversal or recovery. The typical longer-term positions of futures traders registered through the CFTC’s weekly Commitment of Traders (COT) report showed a drop in speculative net long positioning this past week, but not a significant one. While only measuring up to Tuesday and therefore not accounting for the sheer volatility and channel break, there hasn’t been an extreme contrarian positioning to capsize these past two years. At the shorter end of the duration scale, retail traders are still treating EURUSD as if it is trading in a range. A net short swing in the pair according to the IGCS suggests there isn’t a leveraged view that the 200-day moving average break is the signal for a full-blown bull trend to step in.
Chart of Net Speculative Positioning in Aggregate Dollar Futures from CFTC Report (Weekly)
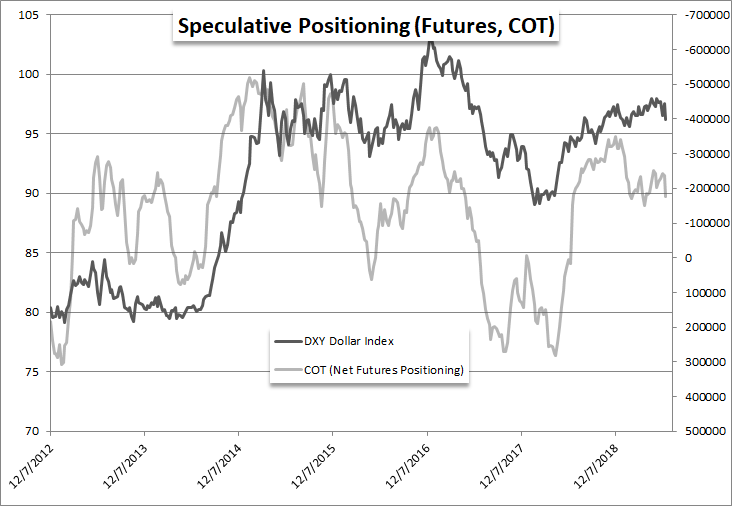
Chart of Retail Trader Positioning from IG Clients (Daily)


