


GBP FORECAST – STERLING WEEKLY TECHNICAL OUTLOOK
- Spot GBP/USD appears on the cusp of forming an inverse head & shoulder technical pattern
- The British Pound looks to develop a new tight trading range against the Euro
- GBP/JPY remains in broad downtrend but risks a retracement higher
- Find out the Traits of Successful Traders with this comprehensive free educational trading guide
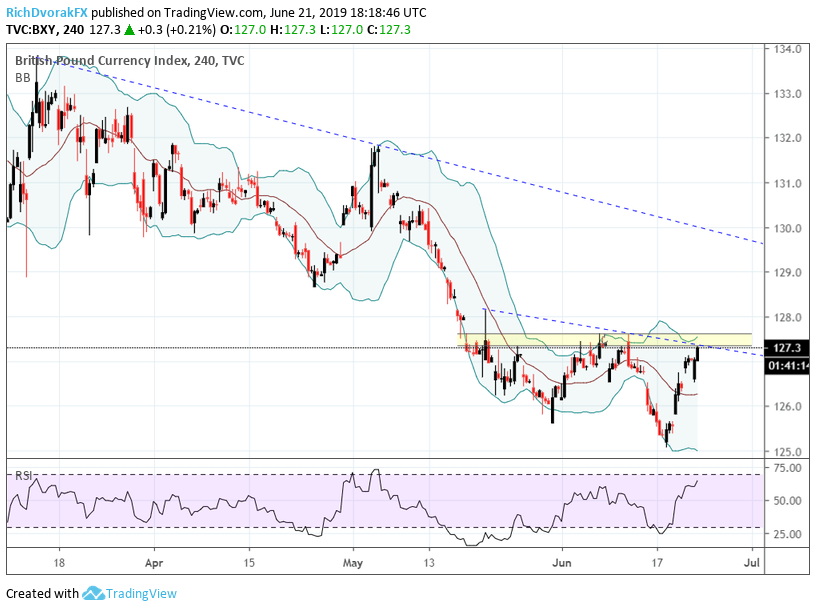
GBP climbed roughly 1 percent over the past week according to the British Pound Currency Index (BXY). While the recent ascent has helped push the Sterling off its lowest level since December 2018, bullish conviction remains overshadowed by the technical damage to GBP charts from broad-based weakness in the British Pound realized since March. Aside from its overarching downtrend, the British Pound could face further headwinds as the currency runs into technical resistance.
BRITISH POUND CURRENCY INDEX (BXY) – CHART 1 (MARCH 11, 2019 TO JUNE 21, 2019: 4 HOUR CANDLES)
Spot GBP/USD has seen an uptick in price action recently – largely owing to the market’s reaction to the June Fed meeting and the central bank’s impact on the US Dollar – and should be kept on every forex trader’s radar. The cable now appears to be forming an inverse head and shoulder pattern with last week’s sharp rise seemingly forming the right half of the head.
SPOT GBP/USD – CHART 2 (OCTOBER 24, 2018 TO JUNE 21, 2019: DAILY CANDLES)
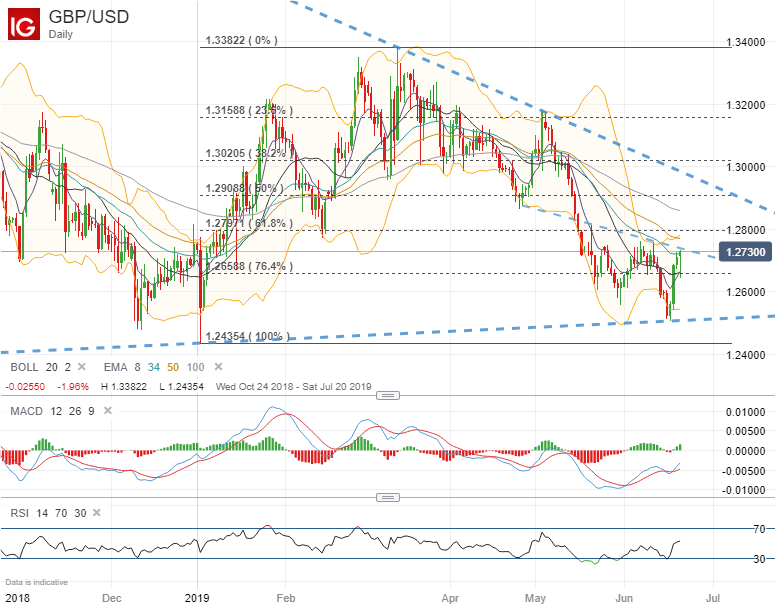
With bearish downtrend resistance from the developing neckline on the potential inverse head & shoulder chart pattern, spot GBP/USD could move lower following a rejection of the confluence area around the 1.2700 mark. Downside might fight support from the 76.4% Fibonacci retracement level drawn from the currency pair’s year-to-date high and low. If spot GBP/USD continues its climb, however, bulls may target the 1.2800 price level which closely aligns with the 61.8% Fib.
SPOT GBP/JPY – CHART 3 (DECEMBER 23, 2018 TO JUNE 21, 2019: DAILY CANDLES)
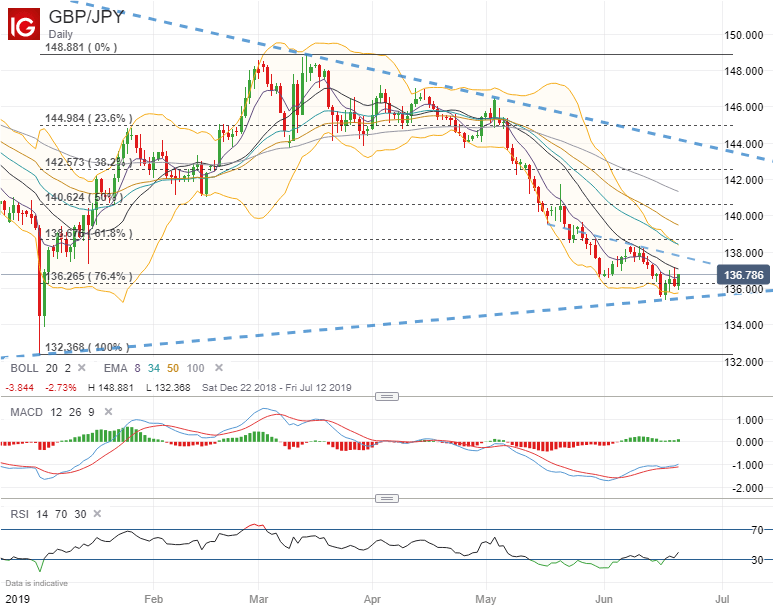
In addition to the widespread influx of risk appetite driven by central bank dovishness, spot GBP/JPY could catch a bid as the currency pair finds support near the 136.00 handle. This zone may bolster prices in the short-term seeing that it is the 76.4% Fibonacci retracement of its year-to-date high and low. Additionally, this is a level where spot rates previously bottomed back in April 2017.
That being said, the steep slide since last month has helped develop another short-term downtrend formed by the series of lower highs while the 20-day simple moving average is another obstacle to overcome for spot GBP/JPY to move higher. Also, risk-aversion threatens to be reignited by rising geopolitical tensions and ongoing US-China trade war uncertainty which would likely bolster demand for the sentiment-geared Japanese Yen and put downward pressure on spot GBP/JPY. In this bearish scenario, the FX rate may drop towards the 134.00 handle and find support where prices rebounded from the Yen flash crash in January.
SPOT EUR/GBP – CHART 4 (NOVEMBER 30, 2018 TO JUNE 21, 2019: DAILY CANDLES)
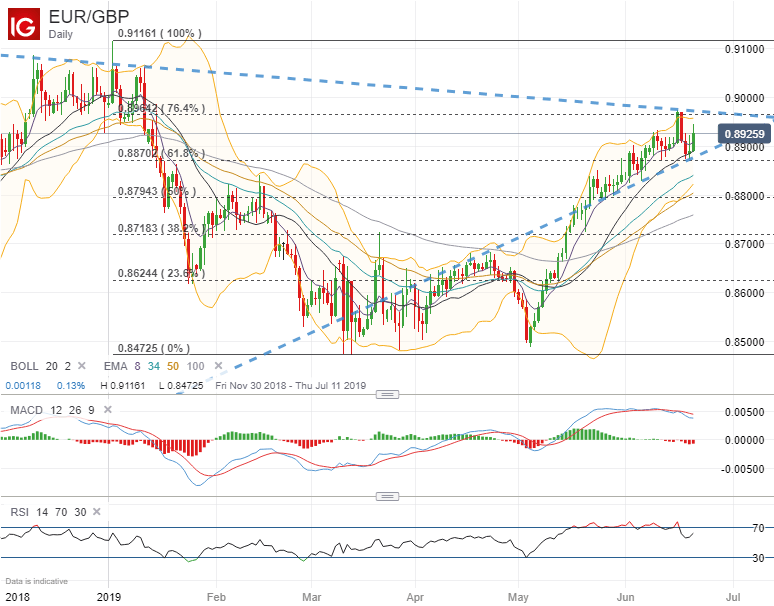
As for spot EUR/GBP, the currency pair may find itself wedged between technical support and resistance levels as traders are tugged between dovish ECB rhetoric and re-emerging concerns over the possibility of no-deal Brexit as hardliner Boris Johnson leads the polls to become next UK Prime Minister. The steep rise in the Euro against the Pound Sterling since the beginning of May looks to be losing momentum and is further suggested by the relative strength index dropping back below the “overbought” level of 70. Also, advances in spot EUR/GBP could be limited by resistance from the 76.4% Fib where the FX rate topped out at 0.89750 this past Monday.
Conversely, EUR/GBP bears may attempt to push spot prices back below the 0.8900 handle towards support posed by the 61.8% Fibonacci retracement level. Breaking below this area could open up the door for further downside in spot EUR/GBP and change in trend which might have potential to drift lower to the 50.0% retracement line near the 0.8800 price level.
- Written by Rich Dvorak, Junior Analyst for DailyFX
- Follow @RichDvorakFX on Twitter


