


S&P 500, DAX Analysis and News

Source: Thomson Reuters, DailyFX
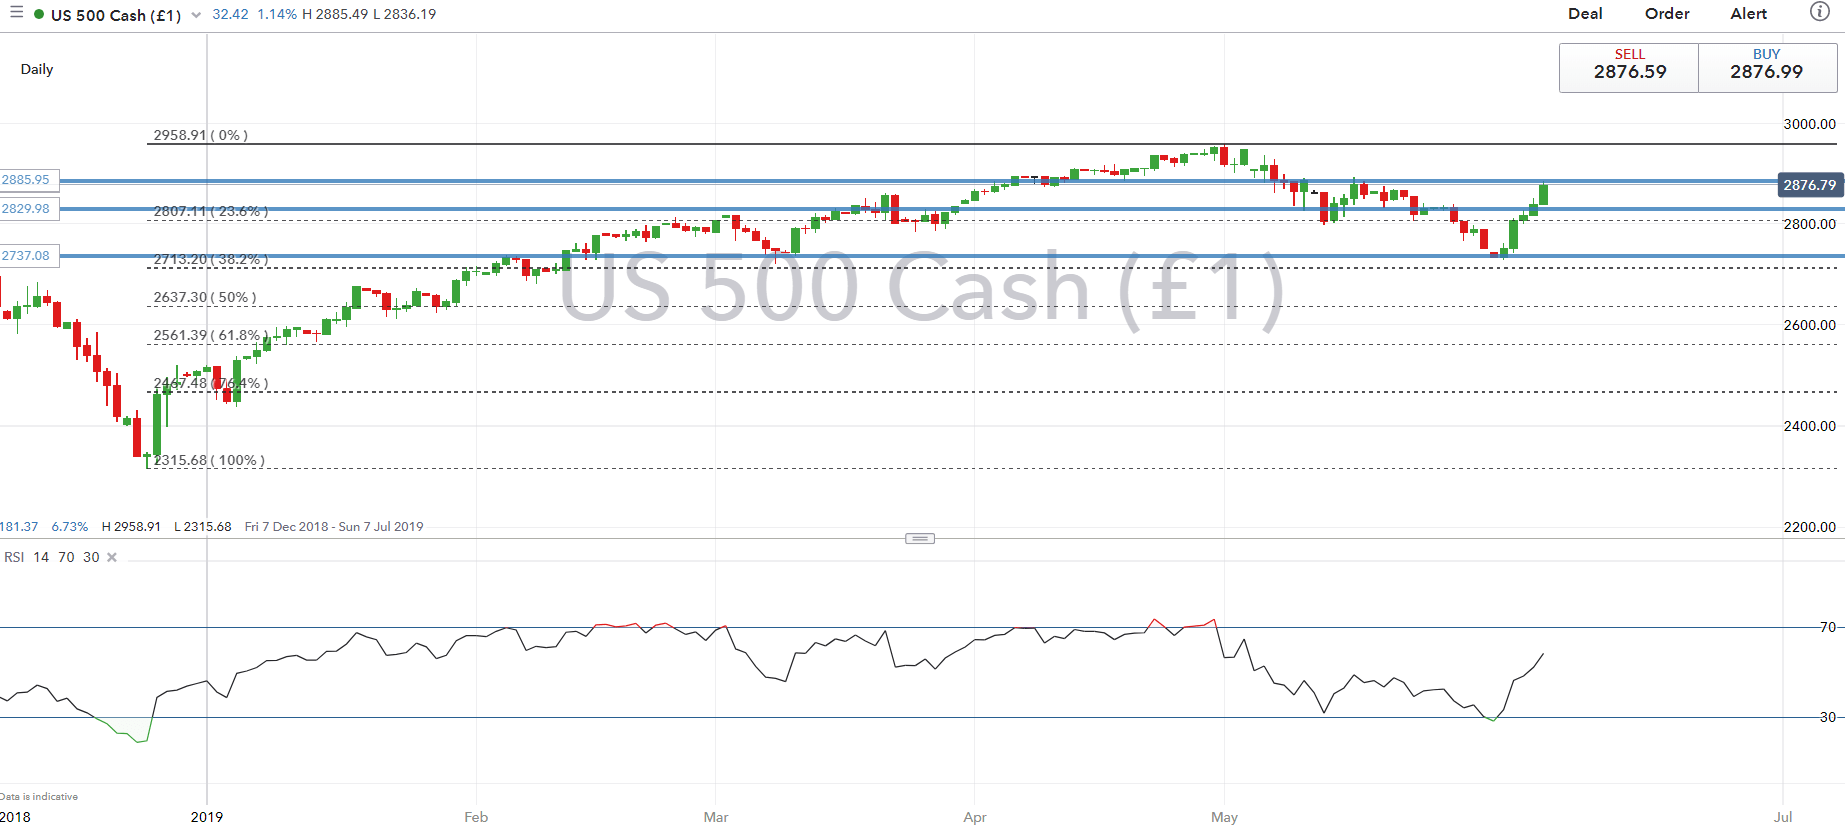
S&P 500 |An impressive start to the month with the S&P 500 rise over 4.5% so far. Dovish commentary from Fed officials helped change the sentiment in the index, this had also coincided with support zone holding at the March lows of 2720-40. Consequently, with 2800 showing little in the way of resistance, the index is back towards 2885-90, which had previously been rejected. On the downside, support is situated at 2830.
S&P Price Chart: Daily Time Frame (Dec 2018 – June 2019)
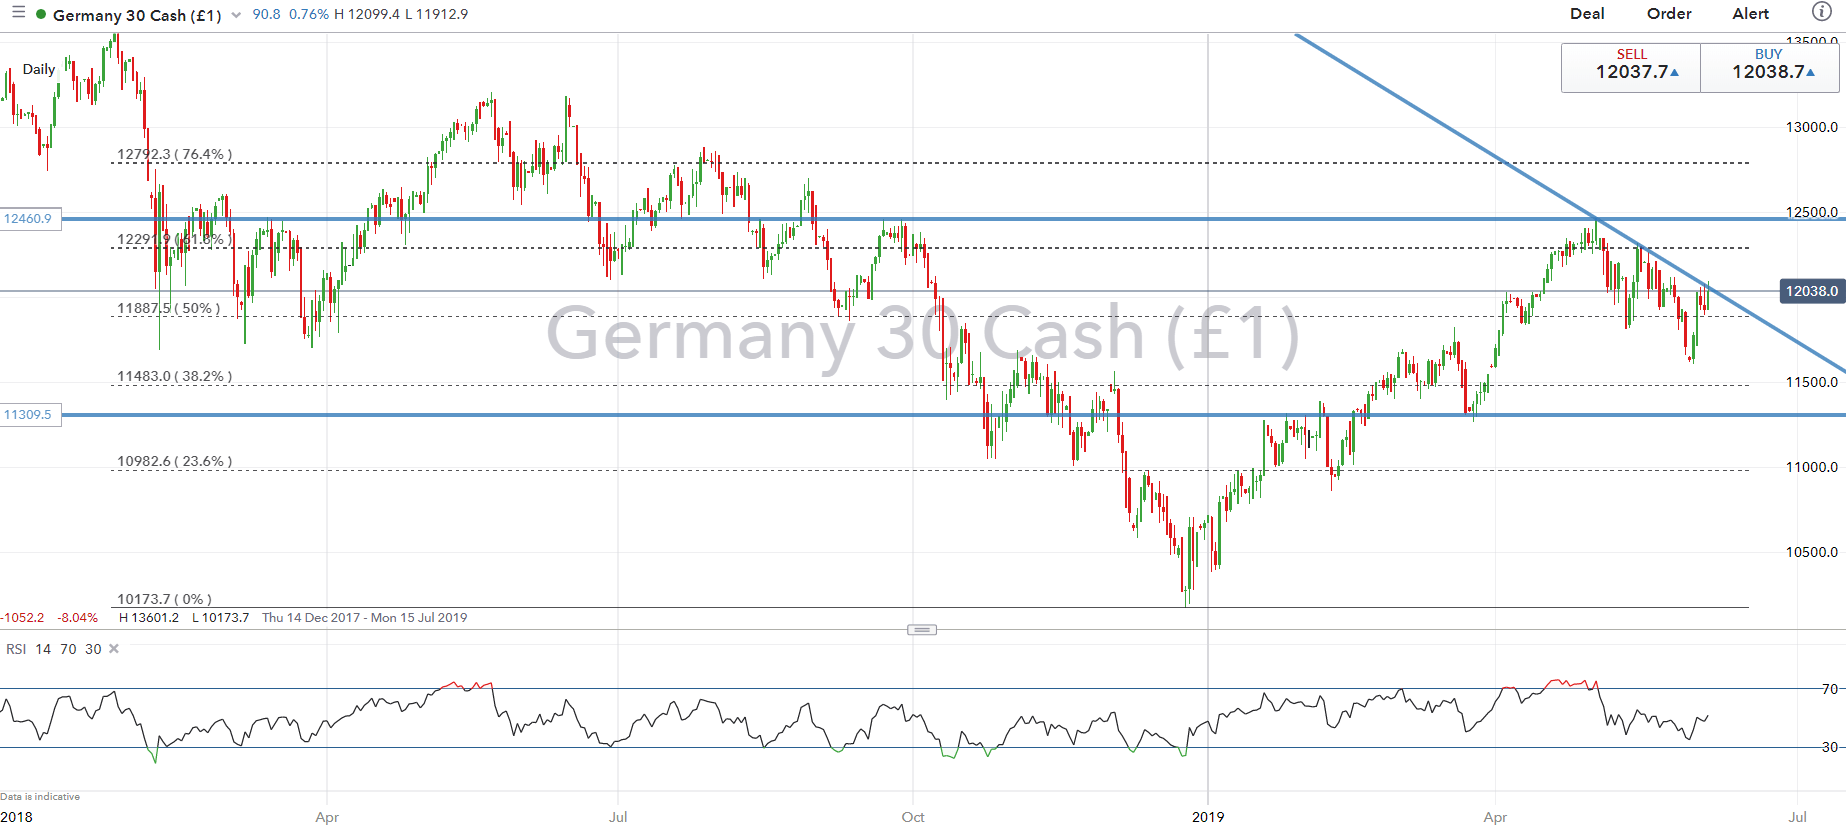
DAX | Trendline Curbs Further Upside
Much like global equities, the DAX has also started the month on the front foot with gains of over 3%. However, further upside in the index has been curbed by the descending trendline from the 2019 peak. As such, for the bullish momentum to persist a closing break is needed to extend towards 12200, while a firm rejection from the trendline resistance exposes the 50% fib support situated 11887.
DAX Price Chart: Daily Time Frame (Dec 2017 – June 2019)
RESOURCES FOR FOREX & CFD TRADERS
Whether you are a new or experienced trader, we have several resources available to help you; indicator for tracking trader sentiment, quarterly trading forecasts, analytical and educational webinars held daily, trading guides to help you improve trading performance, and one specifically for those who are new to forex.
--- Written by Justin McQueen, Market Analyst
To contact Justin, email him at Justin.mcqueen@ig.com
Follow Justin on Twitter @JMcQueenFX


