


S&P 500, DAX, FTSE 100 Analysis and News
- S&P 500 | Consolidation Above 2900 Points to Further Upside
- DAX | Topside Resistance in Focus, Overbought Territory Raises Risk of Exhaustion
- FTSE | Bounce Off Uptrend Low Keeps Upside Momentum Intact

Source: Thomson Reuters, DailyFX
S&P 500 | Consolidation Above 2900 Points to Further Upside
This saw the S&P 500 hit a fresh record peak at 2958, however, gains had not been sustained with the index dropping back towards support at 2900. The trend continues to point to the upside and as such, eyes will be back on the 2940 level as long as the index continues to hover above 2900. However, a closing break below will raise questions as to whether this would spark a more meaningful reversal.
S&P 500 Price Chart: Daily Time Frame (Aug 2018 – May 2019)

DAX | Topside Resistance in Focus, Overbought Territory Raises Risk of Exhaustion
Modest gains for DAX this week, which has consolidated above the 61.8% Fibonacci retracement (12291), in turn, this keeps risks tilted to the upside, albeit modestly so, given that prices are now hovering in overbought territory. Topside resistance is situated at 12460, which represents the Sep 21st and 27th peak. A closing break above keeps 12500 in focus. Implied move for the week ahead is 1.3%.
DAX Price Chart: Daily Time Frame (Oct 2017 – Apr 2019)

FTSE | Bounce Off Uptrend Low Keeps Upside Momentum Intact
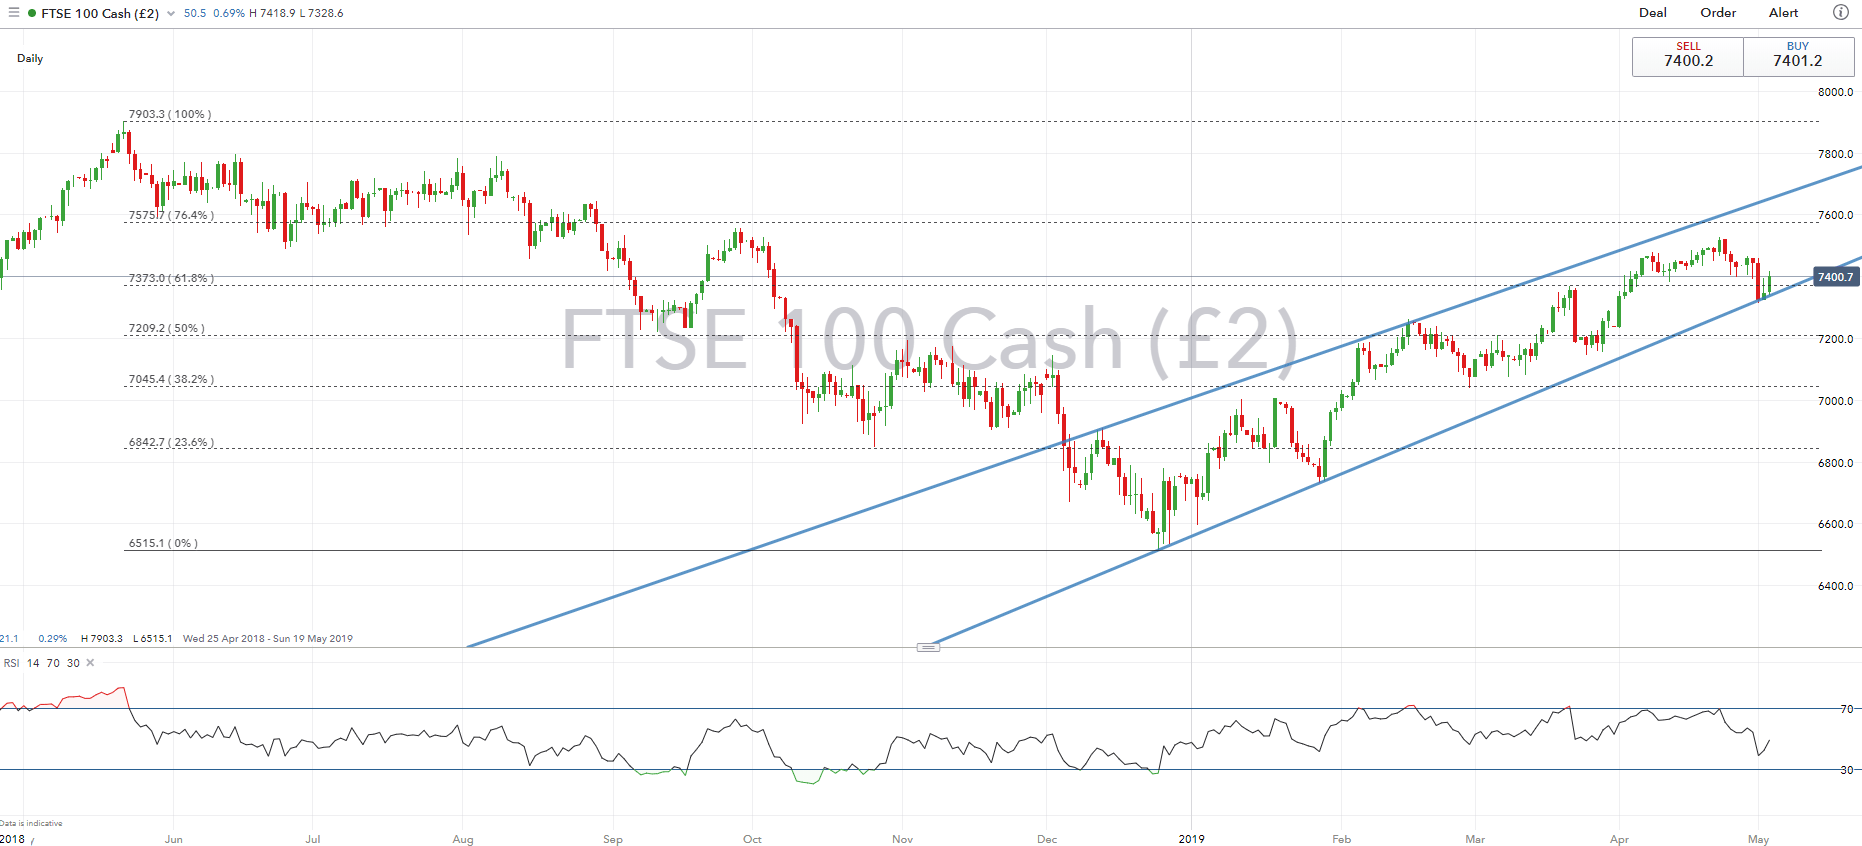
Marginal losses for the FTSE 100 throughout the week, following the pick-up in the Pound midweek. However, the index had managed to curb further losses following a bounce off support from the lower bound of the 2019 uptrend. A weekly close above 7400 would be required in order to maintain the upside momentum, for now the outlook in the short term is neutral. However, a break below the 61.8% Fibonacci retracement could exacerbate a move to the low 7300. Implied move for the week is 1.1%.
FTSE 100 Price Chart: Daily Time Frame (Apr 2018 – May 2019)
RESOURCES FOR FOREX & CFD TRADERS
Whether you are a new or experienced trader, we have several resources available to help you; indicator for tracking trader sentiment, quarterly trading forecasts, analytical and educational webinars held daily, trading guides to help you improve trading performance, and one specifically for those who are new to forex.
--- Written by Justin McQueen, Market Analyst
To contact Justin, email him at Justin.mcqueen@ig.com
Follow Justin on Twitter @JMcQueenFX
Other Weekly Technical Forecast
Crude Oil Weekly Technical Forecast: Support May Soon Lead to Rally
Euro Weekly Price Outlook: EUR/USD Recovery Could be Short Lived
Australian Dollar (AUD) Outlook: AUDUSD Still Looking Into The Abyss?
Pound Surge Has GBPUSD Range to Run, But Resistance Coming in Elsewhere
Gold Price Threatens Major Break After Bears Thwarted At Lows
US Dollar Price Forecast: Whose Brave Enough To Short DXY in May?


