


Crude Oil Price Forecast Talking Points:
- The ONE Thing: Long-term crude oil charts are flashing warning signs, but that is not enough to get outright short despite weakness that capped off last week. There remain two key shelves of support at $62.4/bbl and $58/bbl respectively, and a failure to trade below these levels with a business cycle that is yet to turnover with a tightening physical crude backdrop keep my focus higher despite the stronger US Dollar.
- What’s the risk to my view? The business cycle turning lower (i.e., imminent global recession) appears to be the biggest risk because OPEC+ (a moniker of OPEC and key allies) have trimmed production to support oil at current demand points. My view is that only a sharp drop in demand would usher in the next ‘crash’ in oil.
- What’s a professional crude trader’s view? This podcast with Brynne Kelly is a can’t miss view on oil trading from the platform of the world's largest merchants
You are in luck, DailyFX’s Q2 2019 Crude Oil Forecast was recently released
Technical Forecast for USOIL: Neutral
This weekly chart is the most worrisome to me when looking at crude oil’s prospects. You can see the weekly candle ran out of steam, as evidenced by the tall upside wick into the Andrew’s Pitchfork median line, weekly Ichimoku Cloud, and closing in on the 10-yr falling trendline.
Key short-term support on the weekly WTI crude oil chart with Ichimoku applied is near $60/bbl.
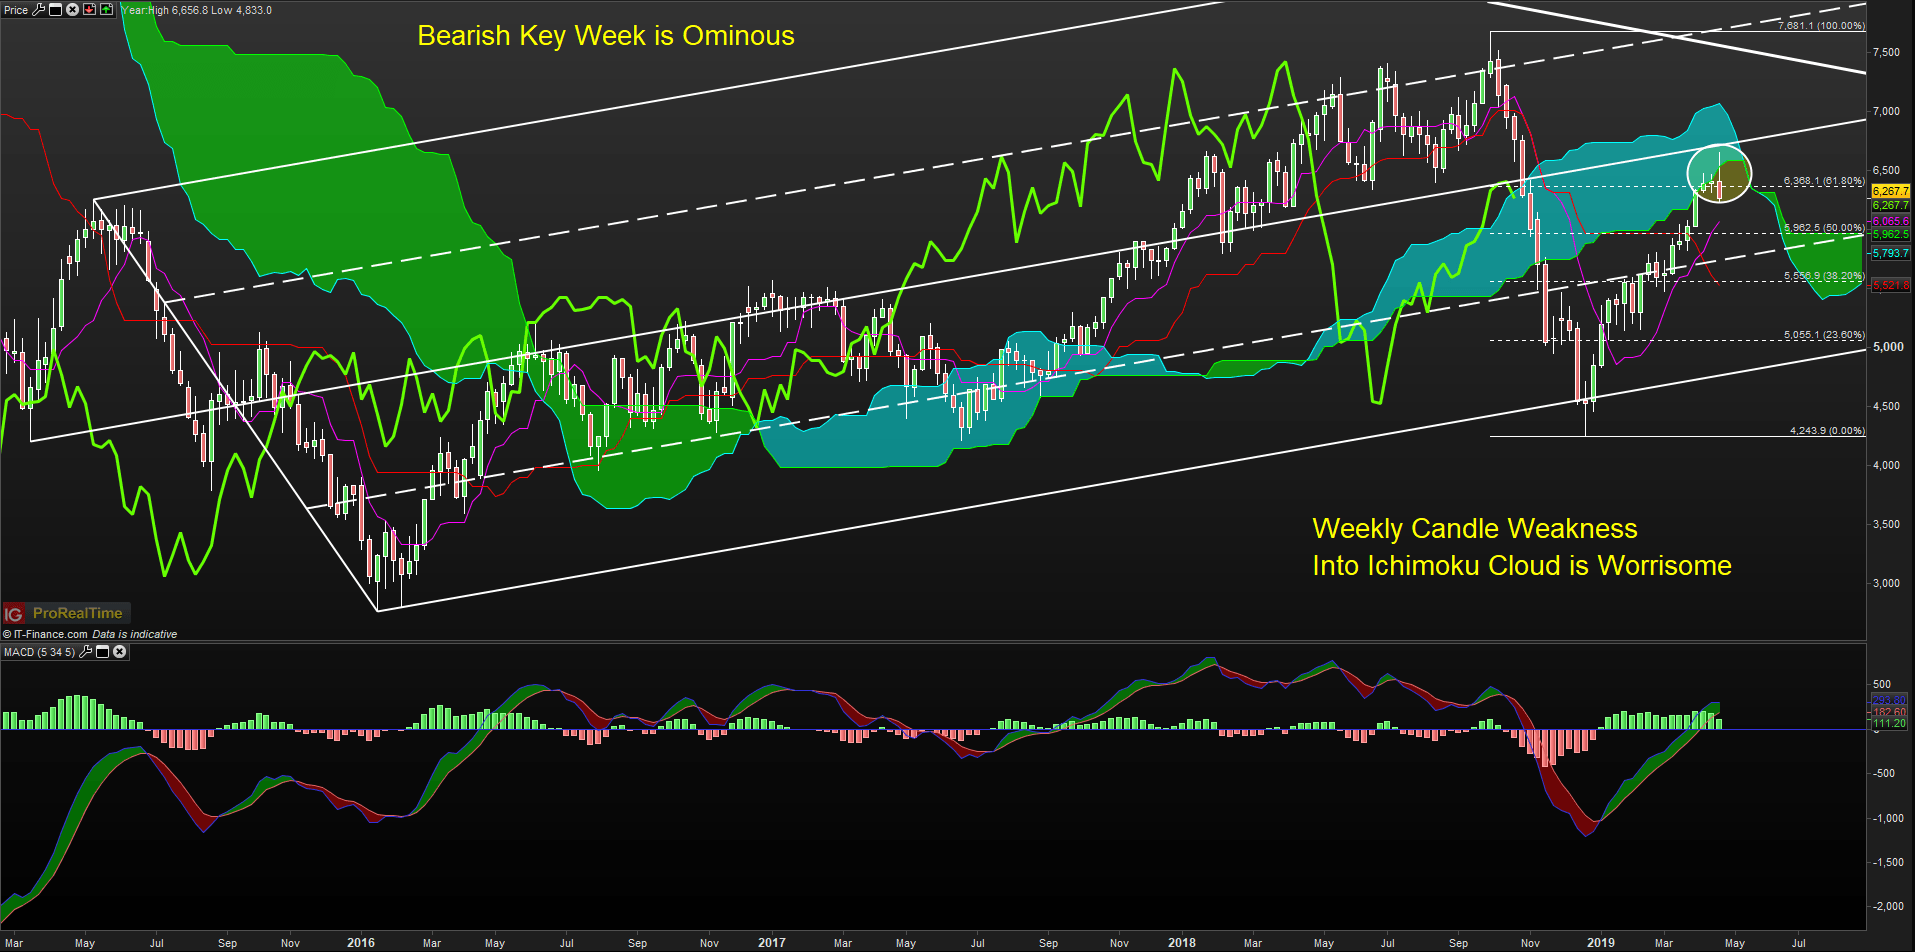
Chart Source: ProRealTime charting, IG UK Price Feed. Created by Tyler Yell, CMT
The key development that brings caution to the bullish crude trader, though not enough to initiate a short, but rather, favor a small pullback within the uptrend is the MACD (5,35,5) momentum resistance. The steep slope into momentum resistance is concerning, but without a move below $62.4 and $58/bbl, the odds to me tilt to further gains, which will soon be explained.
The labels on the chart are presumed Elliott Wave labels. Elliott Wave is excellent for putting the market into context, but like everything, it lacks certainty. However, the bounce in early 2019 was perceived at the beginning of this year to be a correction to the Q4 drop, which would argue for a broader drop developing similar to H2 2008, H2 2014, or Q4 2018 per Elliott.
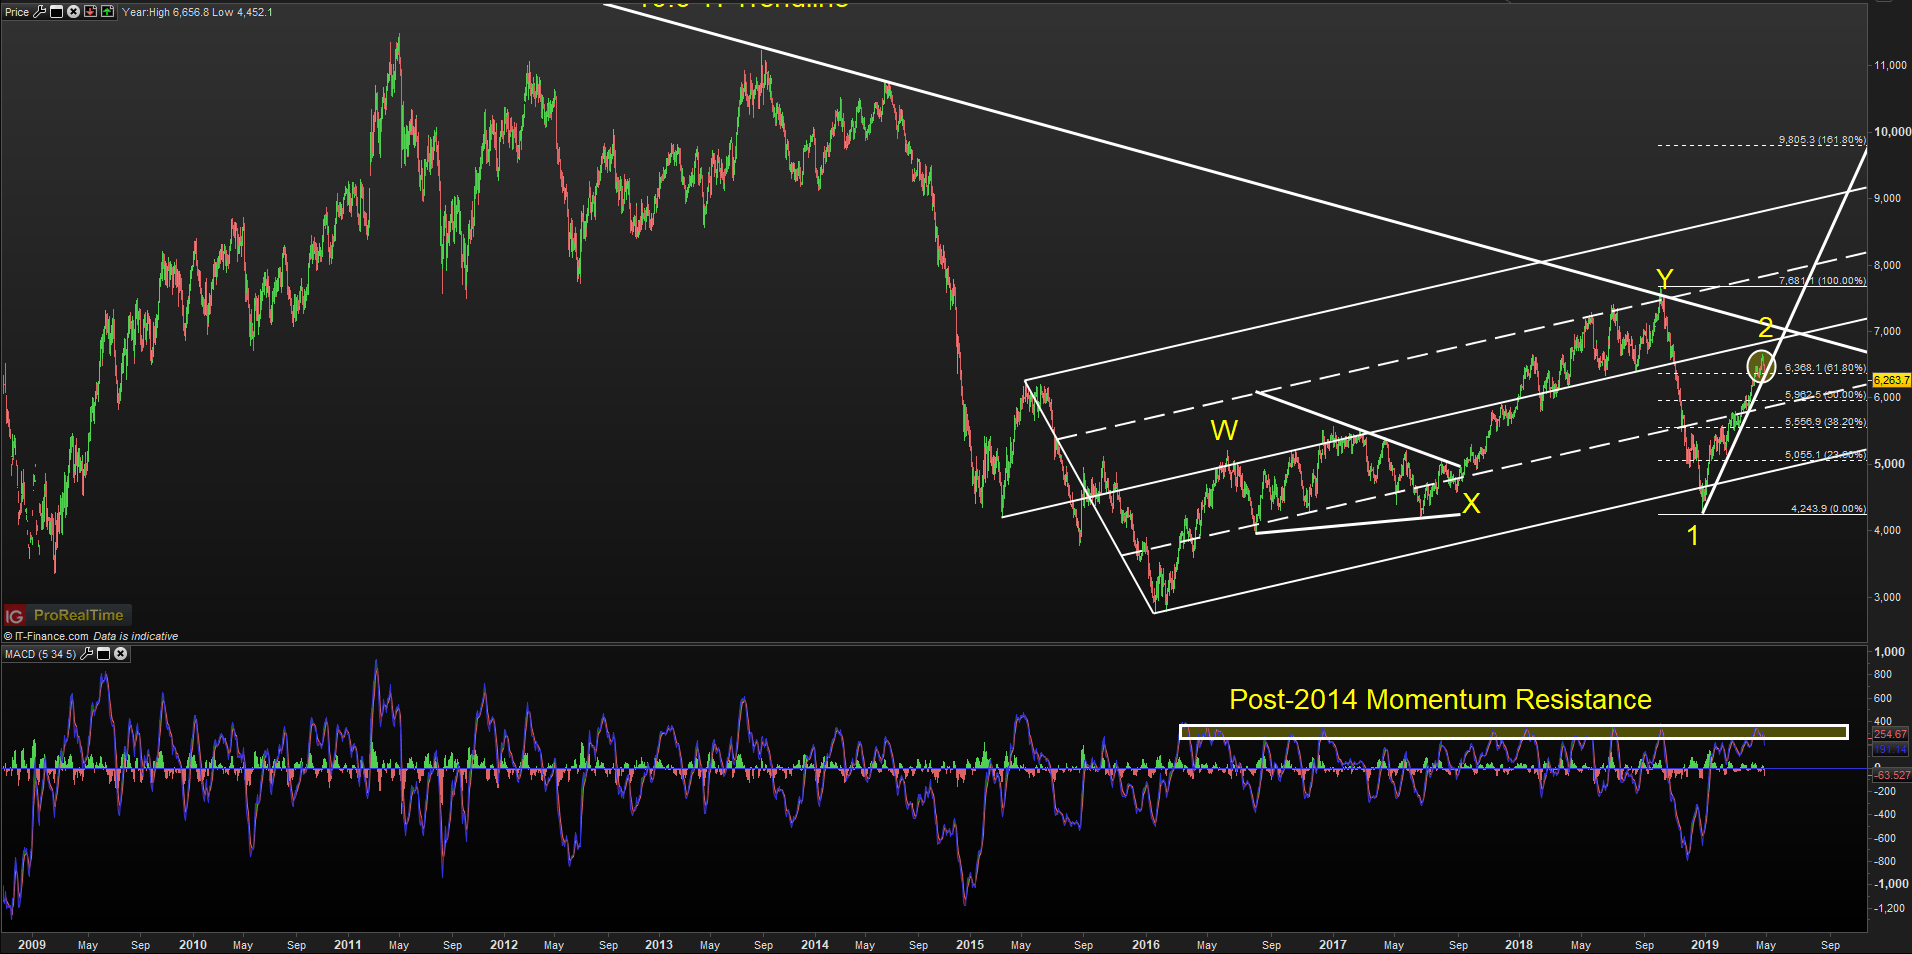
Chart Source: ProRealTime charting, IG UK Price Feed. Created by Tyler Yell, CMT
Short(er)-term charts are a thing of beauty. They allow you to drill down on the details witnessed in the big pictures above.
The four-hour chart below shows that price has dipped below the four-hour cloud alongside momentum (bright green line, or Ichimoku lagging line), which would indicator broader short-term bearish momentum.
The highlighted levels here are $62.4/bbl and $58/bbl, which I’ve shown above, but here you can see these levels also align with prior corrections that preceded trend continuation. The next move to watch is a move either toward $58/bbl or a recovery.
A break below $58, which would be a ~15% drop from the current-cycle high, would start to raise questions about a broader shift, and fundamentals like business cycle turning, positioning, and physical tightening will be looked to confirm the view from neutral to possibly bearish.
An increasingly strong US Dollar, which has recently traded to the highest level since summer 2017 would also hurt the prospects for further crude oil gains.
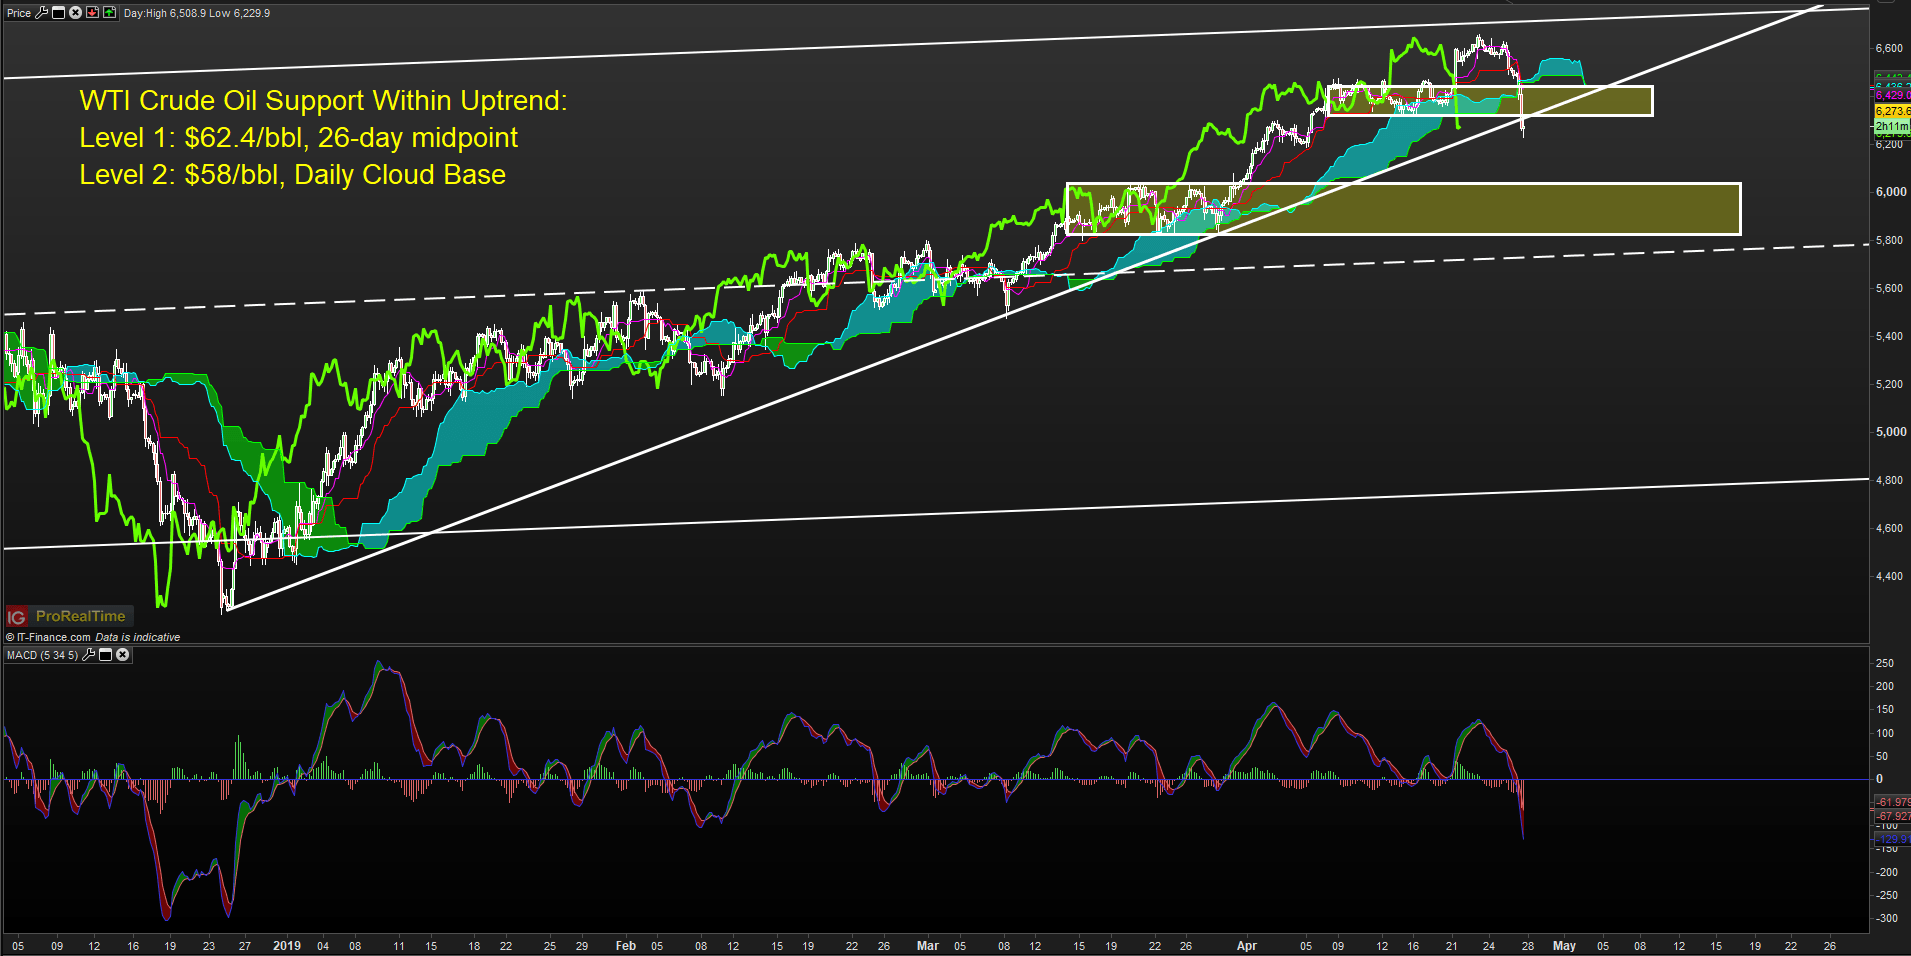
Chart Source: ProRealTime charting, IG UK Price Feed. Created by Tyler Yell, CMT
Looking at Supporting Factors for Crude: Positioning & Spreads
The chart below shows positioning from institutions (non-commercials) per the CFTC data. Notice the difference between the top in early October and the current move?
In October, the positions or longs from institutions had been steadily falling bringing about massive divergence. Currently, bullish positioning continues to build, while at the same time, though not shown, options data doesn’t have traders buying protection of sharp drops.
With institutions still buying, it’s tough for me to get bearish. The end of week price drop may be seen as an opportunity to re-load for any that have recently taken profits.
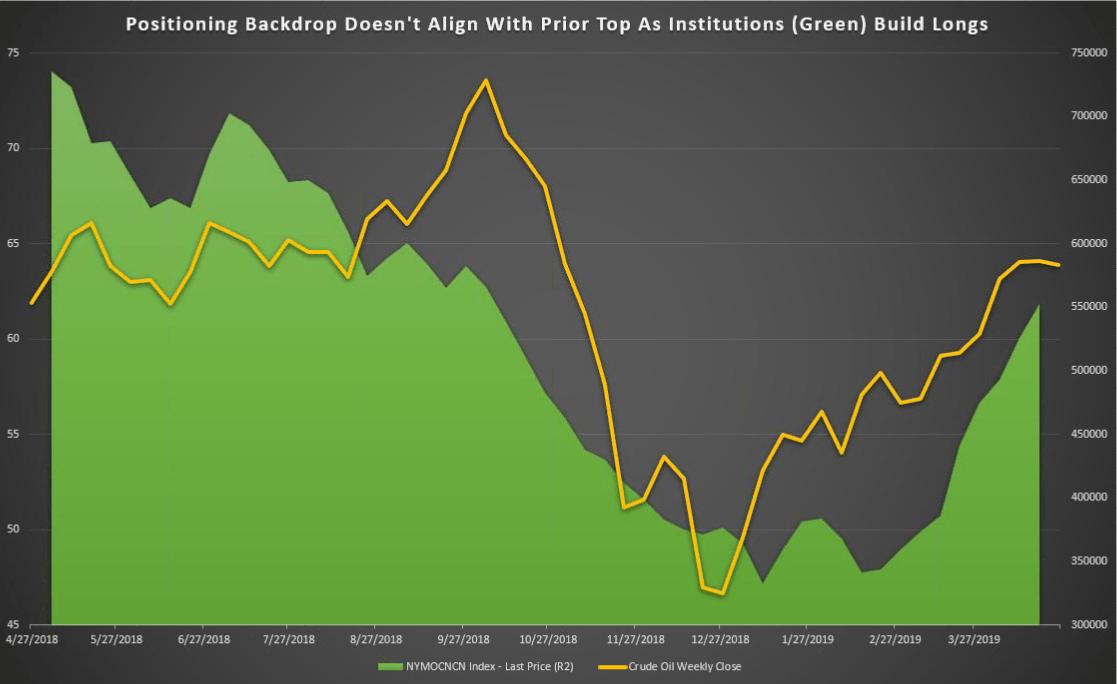
Source: Bloomberg
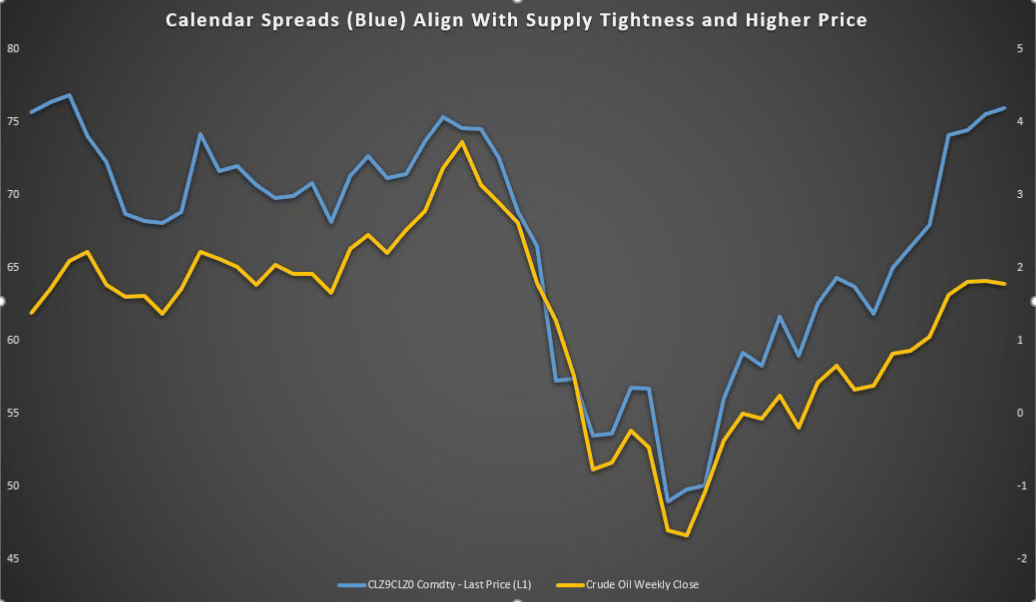
Lastly, calendar spreads continue to show tightness. What surprises me, is that the market is pricing a higher premium now for a forward month-contract compared to a later-dated contract (indicating tightness) than they were in October when Crude traded to $76.80.
The environment has changed since then, but this shows me that the pricing is not as unfounded today as it may have been before the sharp macro-correction that was witnessed in Q4 2018.
We’ll see.
Source: Bloomberg
Australian Dollar Forecast - Aussie Price Forecast: AUD/USD, AUD/JPY Near Critical Support
Follow the DailyFX Podcasts on A Platform That Suits You
iTunes: https://itunes.apple.com/us/podcast/trading-global-markets-decoded/id1440995971
Stitcher: https://www.stitcher.com/podcast/trading-global-markets-decoded-with-dailyfx
Soundcloud: https://soundcloud.com/user-943631370
Google Play: https://play.google.com/music/listen?u=0#/ps/Iuoq7v7xqjefyqthmypwp3x5aoi
---Written by Tyler Yell, CMT
Tyler Yell is a Chartered Market Technician. Tyler provides Technical analysis that is powered by fundamental factors on key markets as well as trading educational resources. Read more of Tyler’s Technical reports via his bio page.
Communicate with Tyler and have your shout below by posting in the comments area. Feel free to include your market views as well.
Talk markets on twitter @ForexYell
https://itunes.apple.com/us/podcast/trading-global-markets-decoded/id1440995971


