


Crude Oil Price Four-Hour Chart
Crude Oil Price Talking Points:
- Oil Price Forecast: Crude Oil Crafts Lower-High After Support Bounce.
- Crude Oil Price May Recoil at Chart Barrier as Market Mood Sours.
Crude Oil Price Forecast: Neutral
Crude Oil Holds Support, but Bulls Shy Away from the Highs
Oil prices have started to digest recent gains, marked by a respect of both support and resistance during this week’s trade. Coming into the week, I had looked at bullish strategies in Oil, driven by the potential for trend continuation in a move that’s been showing over the past three months. The first support zone identified in last week’s Oil Forecast came into play shortly after the weekly open, and prices put in a respectable bounce-higher in the first-half of the period. But, as discussed on Wednesday, buyers pulled back just shy of a re-test of prior highs; and this has led into a pattern of lower-highs to go along with a horizontal zone of support.
Crude Oil Price Two-Hour Chart
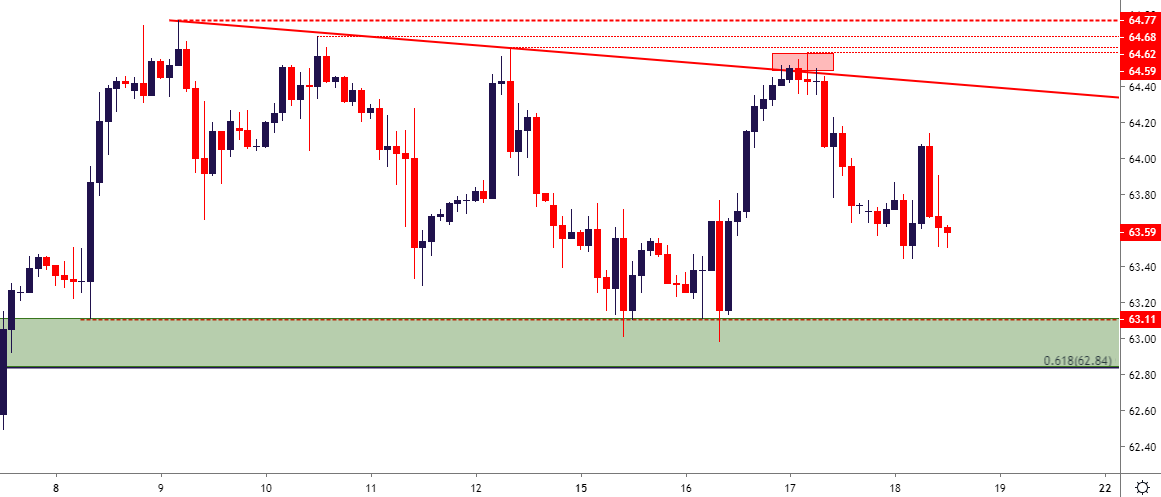
Chart prepared by James Stanley
At this point, Crude Oil prices have gained as much as 52.7% from the December low; a respectable run by almost any metric. Prices have continued to stretch higher in the opening weeks of Q2, with a hastening in that trend coming into this week.
The big question is whether a larger pullback might be needed before bulls can get back in the driver’s seat in the longer-term trend. On the four-hour chart, a case can be made that a descending triangle has started to build, taking the recent series of lower-highs to go along with that horizontal support. And if we consider the resistance potential around the 65.00-handle, as the psychological level remains very near a key Fibonacci level at 64.89, and there could be ample motive for bulls to continue to shy away from re-tests of resistance, thereby allowing for the continued build of lower-highs.
But at this stage, there is nothing to suggest that this would be more than a near-term pullback in the almost four-month-old trend. This highlights deeper support potential on the chart, looking at the ‘s2’ and ‘s3’ zones from last week’s forecast. The area from 61.58-61.87 is a group of swing-lows from earlier in April, and the area around 60.00-60.35 was a key zone of resistance in the month of March that, to date, hasn’t yet been tested for higher-low support.
Crude Oil Price Four-Hour Chart

Chart prepared by James Stanley
Crude Oil Price Forecast: Neutral
Given the distance away from current prices to the ‘s2’ zone looked at above, the technical forecast for Crude Oil will be set to neutral for the week ahead. A re-test of support in the 61.58-61.87 or 60.00-60.35 zones can re-open the door for bullish strategies; but until then, traders should remain cautious of a deeper pullback in what appears to be an overbought trend struggling at fresh highs.
Crude Oil Price Daily Chart
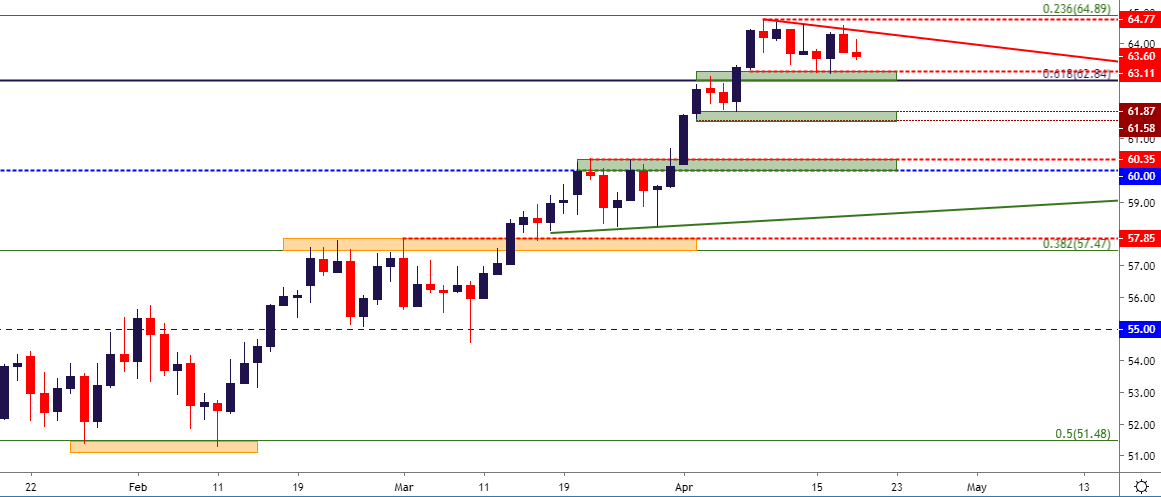
Chart prepared by James Stanley
To read more:
Are you looking for longer-term analysis on the U.S. Dollar? Our DailyFX Forecasts for Q1 have a section for each major currency, and we also offer a plethora of resources on USD-pairs such as EUR/USD, GBP/USD, USD/JPY, AUD/USD. Traders can also stay up with near-term positioning via our IG Client Sentiment Indicator.
Forex Trading Resources
DailyFX offers an abundance of tools, indicators and resources to help traders. For those looking for trading ideas, our IG Client Sentiment shows the positioning of retail traders with actual live trades and positions. Our trading guides bring our DailyFX Quarterly Forecasts and our Top Trading Opportunities; and our real-time news feed has intra-day interactions from the DailyFX team. And if you’re looking for real-time analysis, our DailyFX Webinars offer numerous sessions each week in which you can see how and why we’re looking at what we’re looking at.
If you’re looking for educational information, our New to FX guide is there to help new(er) traders while our Traits of Successful Traders research is built to help sharpen the skill set by focusing on risk and trade management.
--- Written by James Stanley, Strategist for DailyFX.com
Contact and follow James on Twitter: @JStanleyFX
Other Weekly Technical Forecast:
Australian Dollar Forecast: AUD/USD and EUR/AUD May Be at Turning Points, Facing Trend Lines


