


Equity Analysis and News
- DAX | 12000 Level Breached After Largest Weekly Gain Since Q4 16
- S&P 500 | 2900 Breakout Possible, However, Warnings Signals Remain
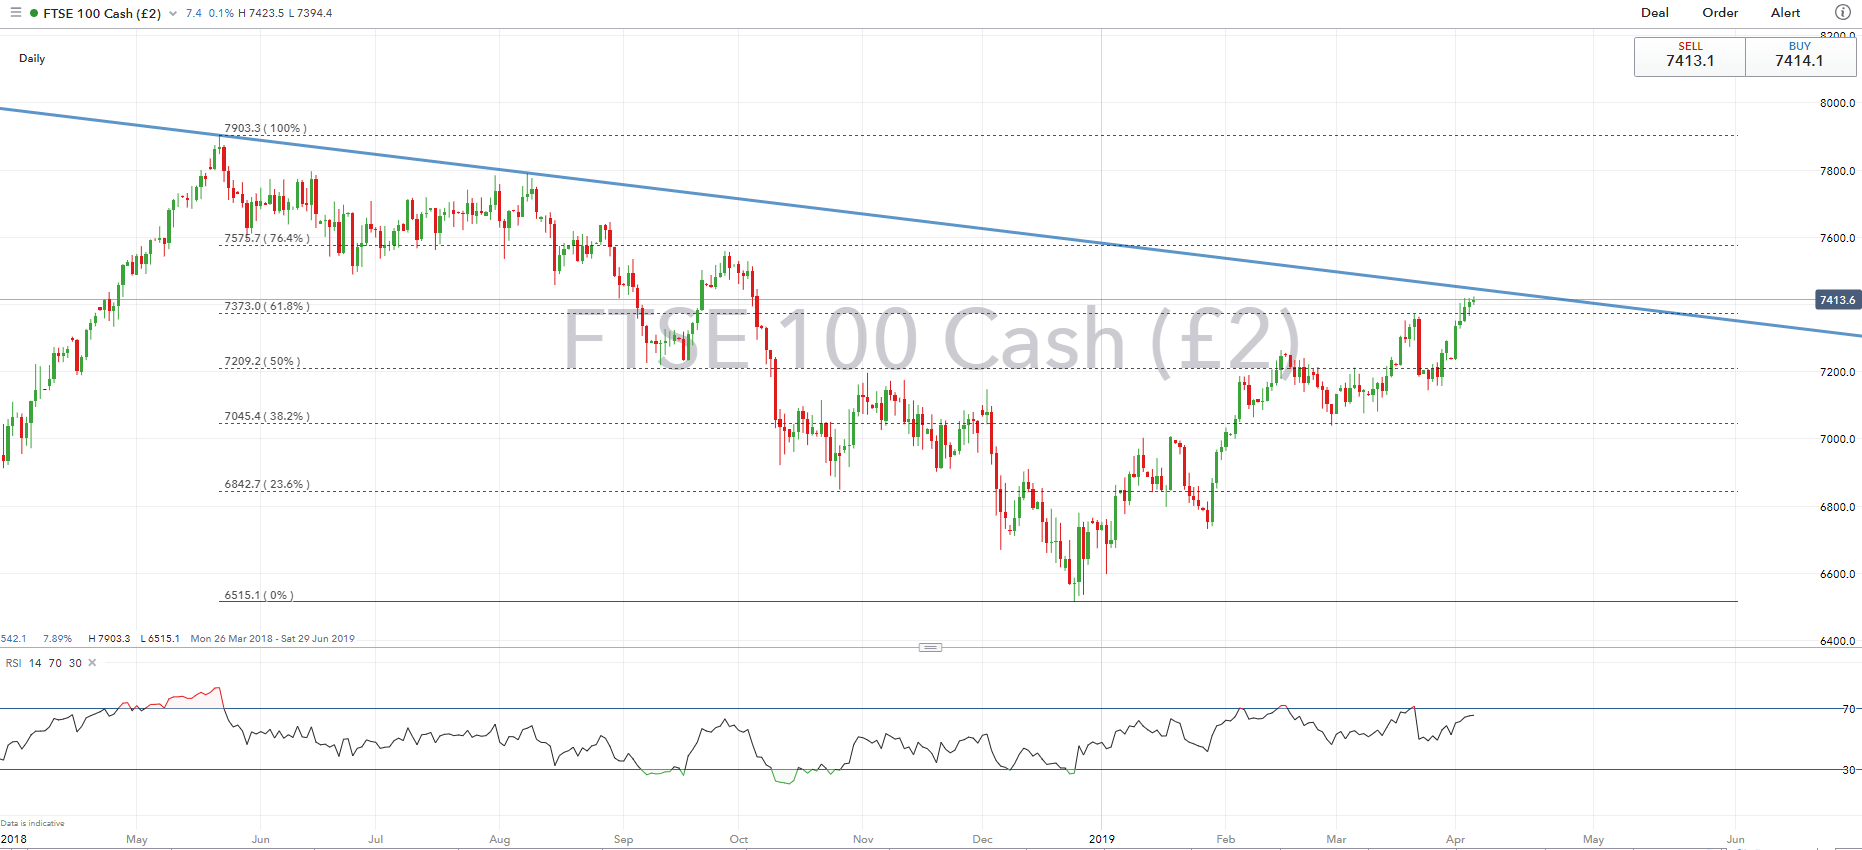
- FTSE 100 | Descending Trendline From Record High in Focus
Looking for a fundamental perspective on Equities? Check out the Weekly Equity Fundamental Forecast.
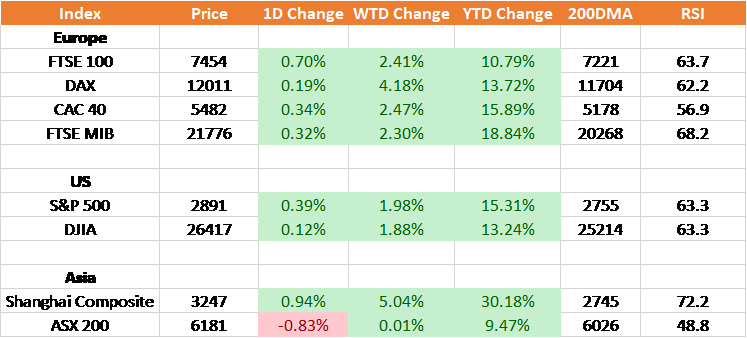
Source: Thomson Reuters, DailyFX
DAX | 12000 Level Breached After Largest Weekly Gain Since Q4 16
The DAX saw its best week since Q4 2016 with gains of 4.2% to break above 12000. However, following this week’s strong gains, the DAX is now hovering around the top of the rising channel, which in turn raises the risk of a slight pullback with the RSI also edging towards overbought territory. A closing break above however increase scope for a move towards 12300, while a pronounced could see support at the 23.6% Fib tested. As it stands, the current environment of dovish central banks and increased optimism of a trade deal, keeps equity markets afloat.
A strong week for the DAX, which has gained over 3.5% with the index underpinned at the beginning of the week following encouraging data out of China whereby the manufacturing sector moved back into expansionary territory. As a reminder, German companies and in particular the auto sector have a large exposure to China. Alongside this, upbeat PMI figures throughout the Eurozone alleviated fears that the weakness in the manufacturing sector is spreading the whole economy as the services sector picked up. However, with the DAX approaching the top of the channel and the relative strength index is nearing overbought territory, which in turn may see the psychological 12000 out of reach in the near-term.
DAX PRICE CHART: DAILY TIME FRAME (Dec 2017 – Apr 2019)

S&P 500 | 2900 Breakout Could See Record High Test, However, Warnings Signals Remain
The S&P 500 has continued to grind higher with focus now turning towards resistance at 2900, in which we do not rule out a test of the record high (2940) on a topside breakout. However, downside risks are showing with the RSI continuing to show a negative divergence, whereby a break below 50 on the RSI could confirm a wider pullback in the index.
S&P 500 Price Chart: Daily Time Frame (Sep 2018 – Apr 2019)

FTSE 100 | Descending Trendline From Record High In Focus
The FTSE 100 rose a modest 2.4% in the week, which saw the index break above the March high and the 61.8% Fibonacci retracement from the 2018 high to 2018 low. As the index continues to push for better levels, eyes will be firmly fixed on crucial resistance from the descending trendline stemming from the record high. A closing break above could see the FTSE edge towards 7575-7600, as a reminder, Brexit will continue to remain in focus with expectations that a Brexit extension will be announced at the EU Summit on Wednesday.
RESOURCES FOR FOREX & CFD TRADERS
Whether you are a new or experienced trader, we have several resources available to help you; indicator for tracking trader sentiment, quarterly trading forecasts, analytical and educational webinars held daily, trading guides to help you improve trading performance, and one specifically for those who are new to forex.
--- Written by Justin McQueen, Market Analyst
To contact Justin, email him at Justin.mcqueen@ig.com
Follow Justin on Twitter @JMcQueenFX
Other Weekly Technical Forecast:
Australian Dollar Forecast – AUD/USD Outlook Mixed, AUD/NZD and GBP/AUD Flirt with New Trends
Oil Forecast – Crude Oil Prices Hit Fresh 5-Month High with Eyes Glued on Dow and Risk
British Pound Forecast – GBPUSD & EURGBP Trends Creaking


