


Sterling FX-Pairs Technical Analysis
Looking for a fundamental perspective on GBP? Check out the Weekly GBP Fundamental Forecast.
Q1 Trading Forecasts for a wide range of Currencies and Commodities, including GBPUSD and EURGBP with our fundamental and technical medium-term technical outlook.
How to Combine Fundamental and Technical Analysis.
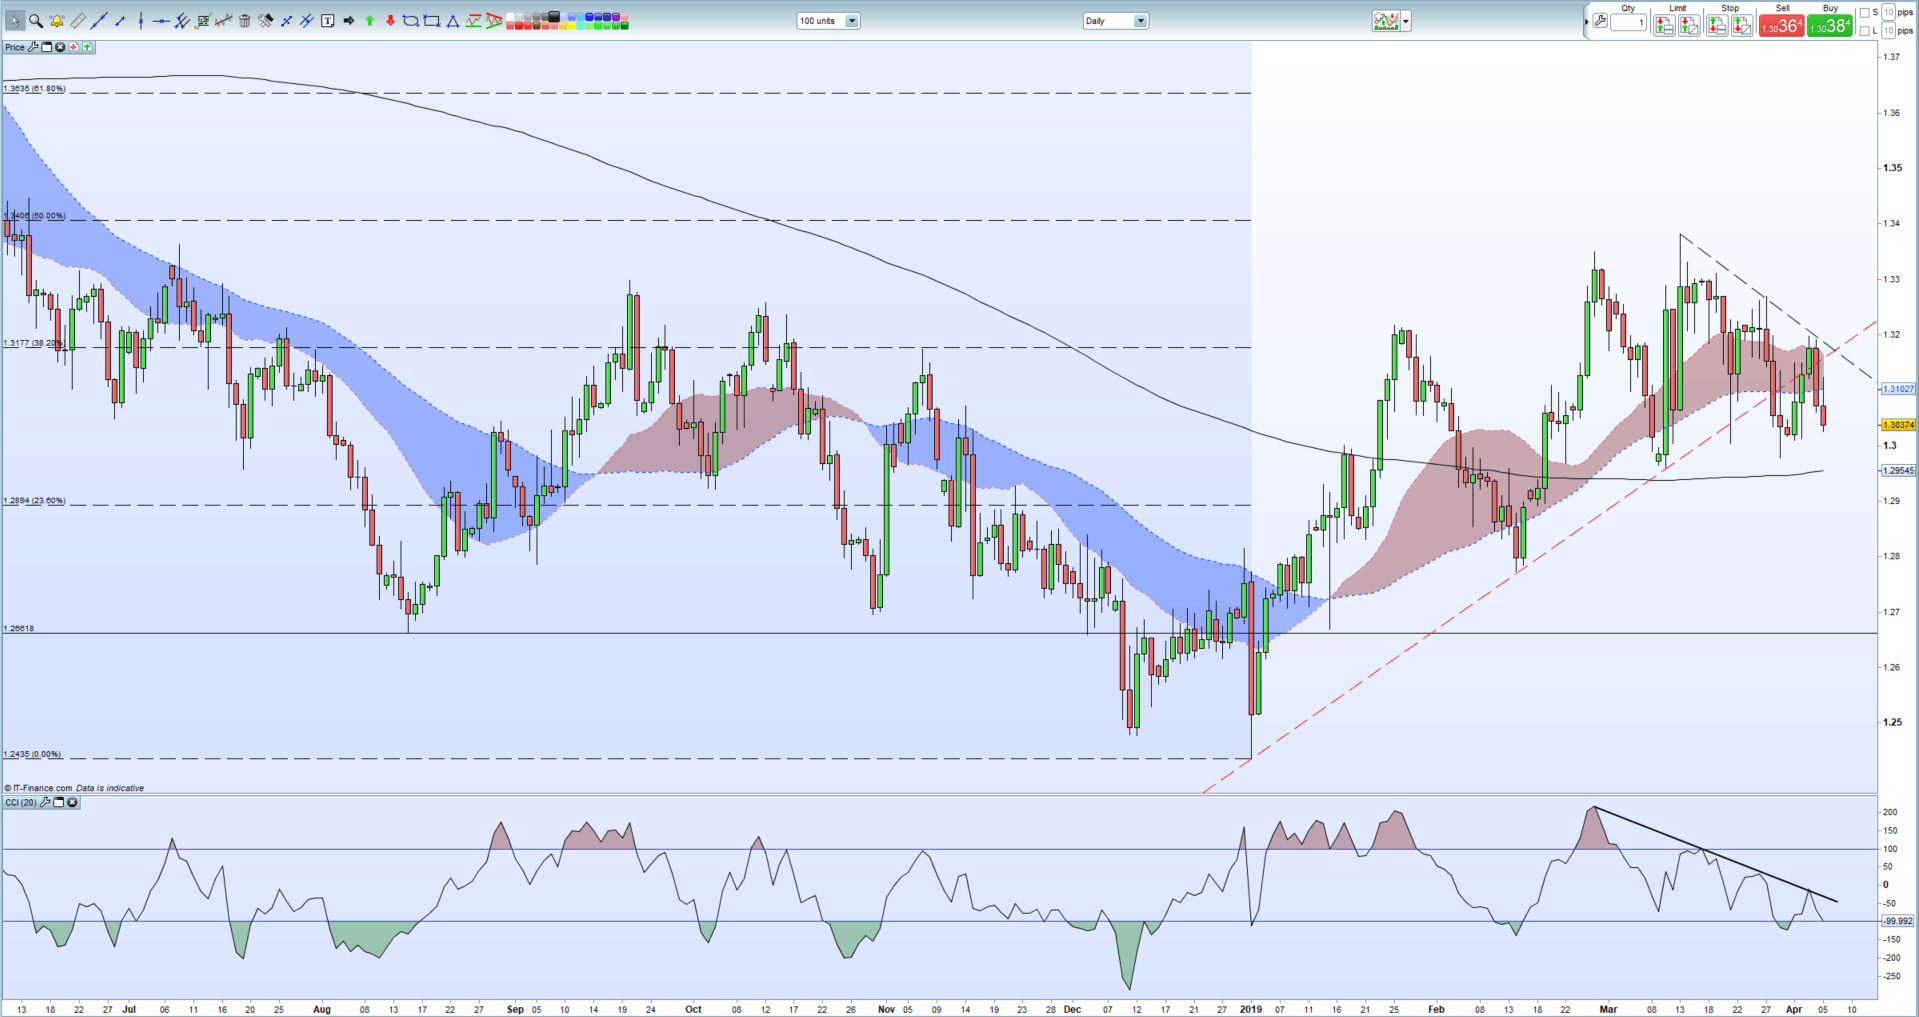
GBPUSD remains above the 1.3000 handle but is finding further upside increasingly difficult after the 2019 trendline turned from support to resistance over the last few sessions. A new downtrend is in place off the March 13 high at 1.3383 and this may hold sway over the next few days unless there is a fundamental shift in ongoing Brexit talks. An interesting confluence of technical indicators is on the cards at the start of next week when the 2019 uptrend meets the recent downtrend and 38.2% Fibonacci retracement around the 1.3175 level. If this level continues to weigh on GBPUSD, then support will start between 1.2980 and 1.3000, ahead of the 200-day moving average - currently at 1.2955 - before the 23.6% Fib retracement comes into play at 1.2894.Support may come from the CCI indicator which is starting to flash an oversold signal around the -100 level.
GBPUSD Daily Price Chart (June 2018 – April 5, 2019)
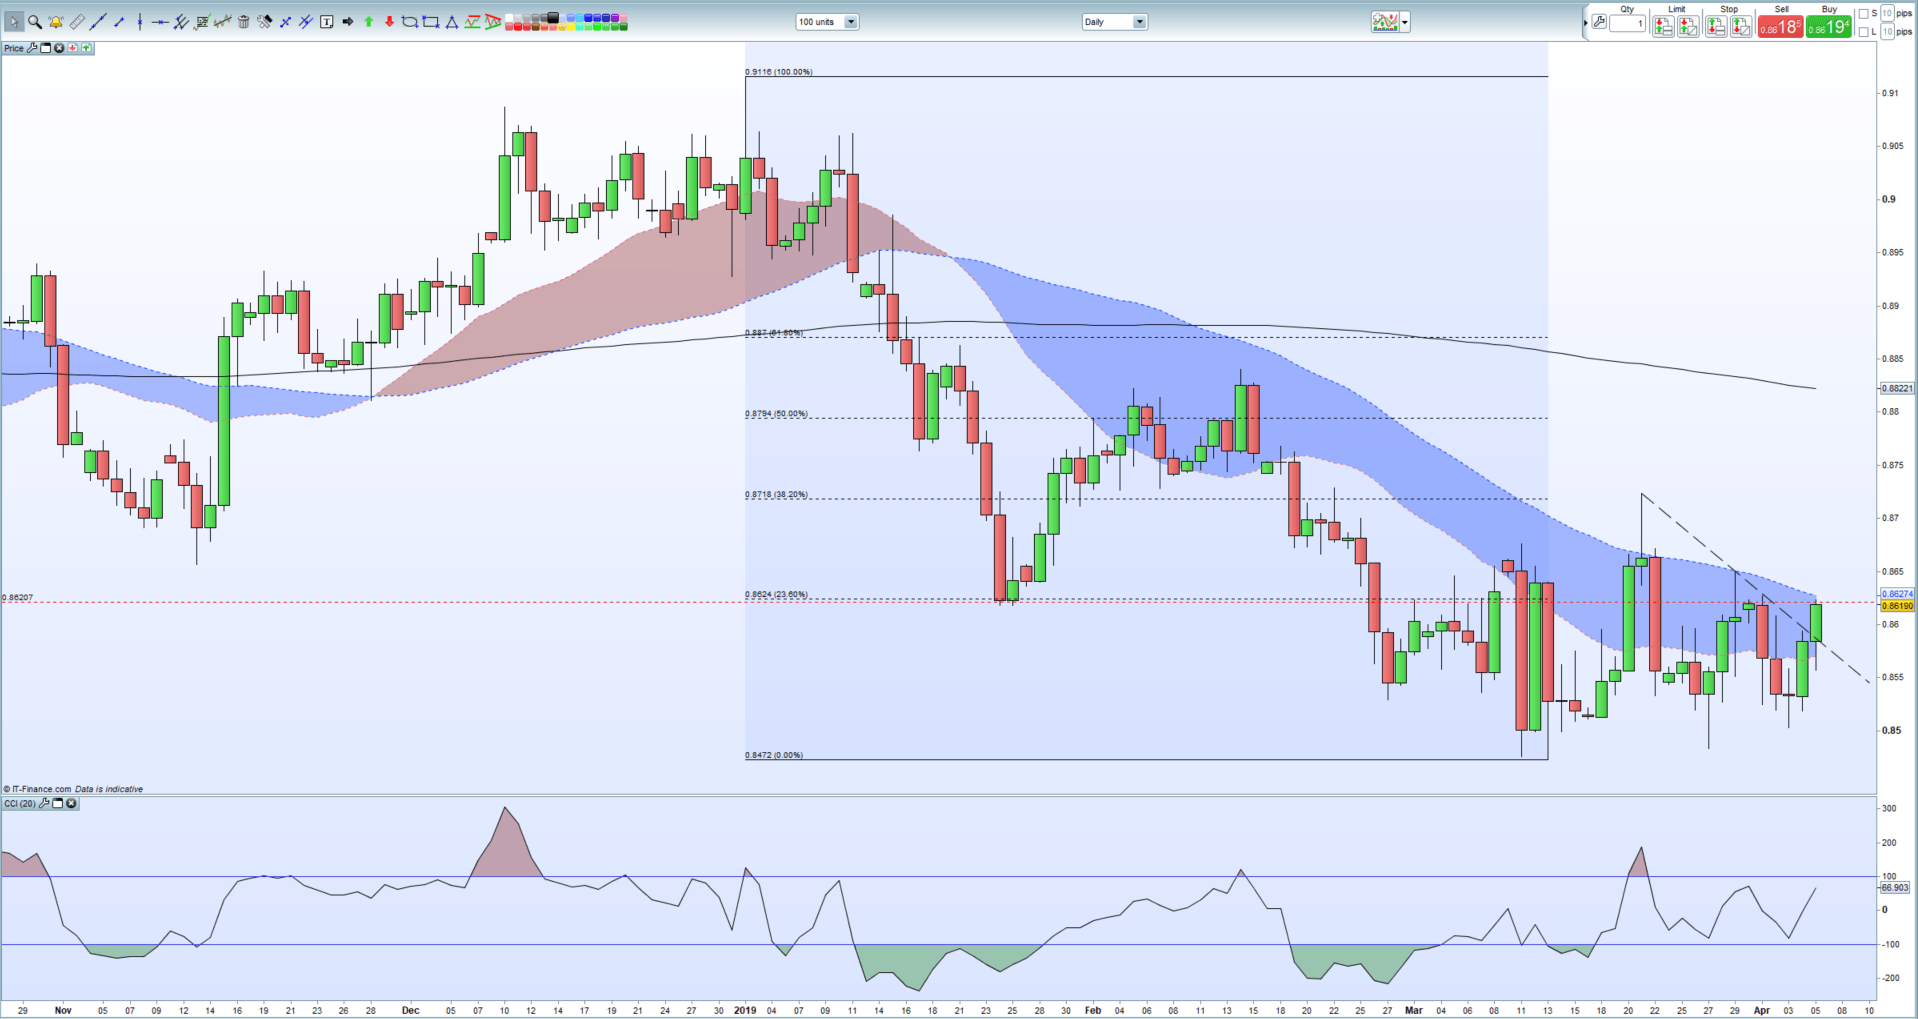
Today’ break of the downtrend from March 21 has left EURGBP in position to move slightly higher but overhead resistance should keep the move in check, all Brexit things being equal. Today’s move higher has also seen the 0.8624 Fibonacci retracement level traded and a close above here would bring in the 0.8671 – 0.8675 level into play before 0.8718 – Fibonacci 38.2% - and the March 21 high at 0.8723 come into play. These levels look likely to hold in the short-term, aided as well by the CCI indicator that is nearing overbought territory. To move lower a close below the recent downtrend will bring into play 0.8518 ahead of 0.8503 and 0.8482 and the multi-month low at 0.8472.
Central Bank Intervention in the Foreign Exchange Market.
EURGBP Daily Price Chart (October 2018 – April 5, 2019)
How Central Banks Impact the Forex Market
DailyFX has a vast amount of resources to help traders make more informed decisions. These include a fully updated Economic Calendar, and a raft of constantly updated Educational and Trading Guides
--- Written by Nick Cawley, Analyst
To contact Nick, email him at nicholas.cawley@ig.com
Follow Nick on Twitter @nickcawley1
Other Weekly Technical Forecast:
Australian Dollar Forecast - AUD/USD Outlook Mixed, AUD/NZD and GBP/AUD Flirt with New Trends
Oil Forecast - Crude Oil Prices Hit Fresh 5-Month High with Eyes Glued on Dow and Risk


