


WEEKLY STOCK MARKET TECHNICAL FORECAST – TALKING POINTS
- The Dow Jones Industrial Average and FTSE 100 equity indices enjoyed healthy advances this past week, gaining 1.38 percent and 1.58 percent respectively
- Stocks will likely turn to US-China Trade War progress in addition to the latest Brexit developments next week as these risks could serve as potential catalysts for a breakout – or breakdown – from recent technical levels
- Looking to expand your trading knowledge? Check out How to Day Trade the Dow Jones
Major equity indices like the Dow Jones and FTSE 100 both gained over 1 percent this past week as stocks across the world enjoyed a risk-on rebound from the prior week’s minor pullback. Despite shaky fundamentals that pose lingering risks, however, it appears that the technical outlook for equities may continue to improve.
DOW JONES PRICE CHART OUTLOOK: DAILY TIME FRAME (OCTOBER 12, 2018 TO MARCH 29, 2019) (CHART 1)
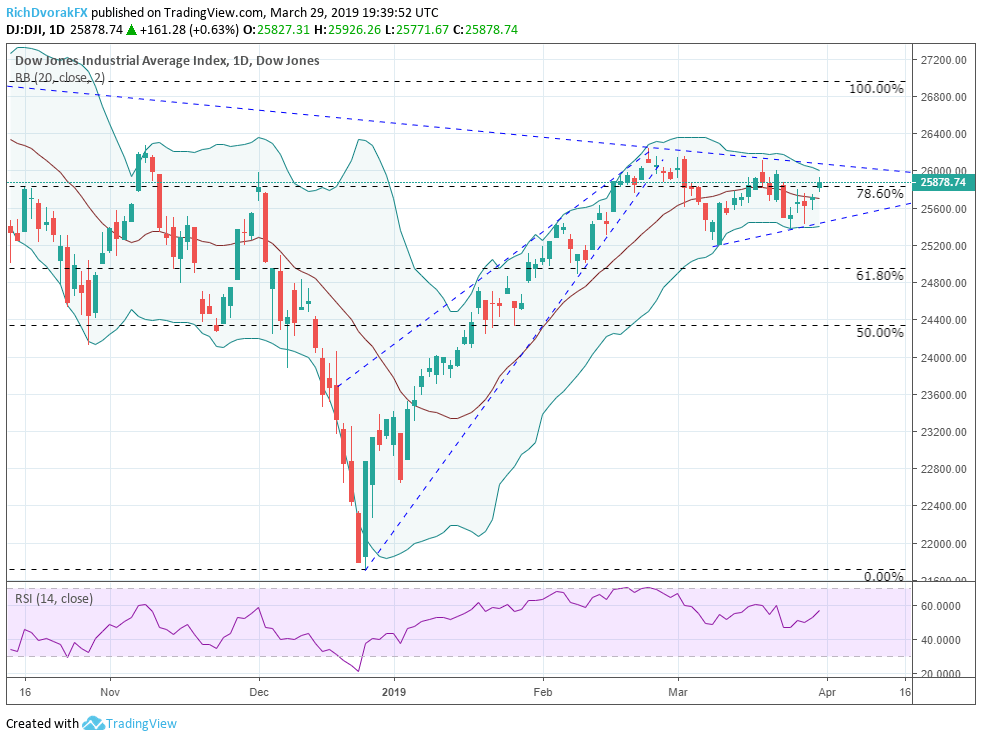
The Dow Jones Industrial Average looks like it is gearing up for another push higher. The US equity index comprised of the largest 30 domestic companies rose back above major confluence around the 78.6 percent Fibonacci retracement line drawn from the respective high and low in October and December of last year.
Do You Know the Major Differences Between the Dow Jones, S&P500 and Nasdaq?
Moreover, DJIA was able to reclaim its 20-day simple moving average this week which could further support additional upside over the near-term. Although the longer-term downtrend extended from the Dow’s high in October 2018 as well as February and March 2019 might serve as resistance and squeeze the index lower, bullish sentiment looks to outweigh this headwind.
Looking for a fundamental perspective on equity? Check out the Weekly Equity Fundamental Forecast.
FTSE 100 PRICE CHART OUTLOOK: DAILY TIME FRAME (SEPTEMBER 12, 2018 TO MARCH 29, 2019) (CHART 2)

The FTSE 100 rests at a precarious level amid the latest Brexit developments which have largely clouded UK outlook. Despite the British equity index’s strong rally so far this year, it appears that gains could be at risk. With the FTSE 100 now sitting between the 61.8 percent and 78.6 percent Fibonacci retracement levels, the British stock market barometer could come under pressure despite the strong rally enjoyed so far this year.
Although the FTSE 100’s recent series of higher highs and higher lows has formed a clear upward trend, prices could come under pressure from the longer-term downtrend formed by the lower highs made in September 2018 and March 2019. That being said, the index has potential to gravitate lower towards support near the 61.8 percent Fibonacci retracement and upward sloping trendline.
TRADING RESOURCES
Whether you are a new or experienced trader, DailyFX has multiple resources available to help you: an indicator for monitoring trader sentiment; quarterly trading forecasts; analytical and educational webinars held daily; trading guides to help you improve trading performance, and even one for those who are new to FX trading.
- Written by Rich Dvorak, Junior Analyst for DailyFX
- Follow @RichDvorakFX on Twitter
Other Weekly Technical Forecast:
Crude Oil Forecast– Crude Oil Prices Edge to 5-Month High, Doesn't Feel Like a 'Breakout'
British Pound Forecast –No Brexit Deal- Pound Losses Mount
US Dollar Forecast – USD Starting to Look Exhausted
Gold Forecast – Gold Price Outlook Bearish in Long Run, Eying Support in Near Term


