


EURUSD Talking Points:
- EURUSD is back in the support zone that’s held the lows over the past five months as the pair has remained confined to a range. That range has held through a variety of drivers, but an overweight retail position combined with a persistent showing from bulls makes the short-side of the pair attractive ahead of the Q2 open. For those looking for short-Euro exposure away from the US Dollar, EURJPY can remain as a candidate for such themes.
- EURUSD has moved back to test a familiar level on the chart at 1.1212, which is the 61.8% Fibonacci retracement of the ‘lifetime move’ in the pair, taking the low from the year 2000 up to the 2008 high.
Do you want to see how retail traders are currently positioned? Check out our IG Client Sentiment Indicator.
Welcome Back, 1.1212
Going back to just a few years ago, EURUSD was stuck in a range while much of the economic world saw the pair breaking-down to parity. This was after the ECB had just gotten started with their QE program; the announcement of which compelled a 3,000+ pip breakdown in EURUSD with prices in the pair testing below the 1.0500 handle. But, as European QE got up and running, EURUSD price action churned within a range for the next two-plus years.
Delineating resistance in that range for most of the period was a key Fibonacci level at the spot price of 1.1212: This is the 61.8% retracement of the ‘lifetime move’ in EURUSD, taking the low from the year 2000 up to the 2008 high.
EURUSD Monthly Price Chart
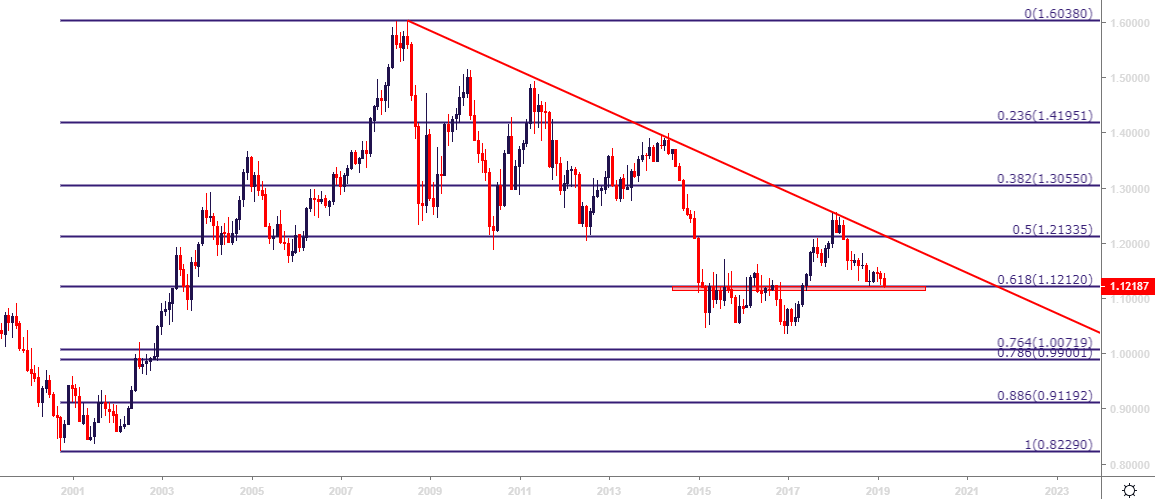
Chart prepared by James Stanley
EURUSD prices left that level behind in June of 2017, just as a wave of rather surprising strength was starting to show in the single currency. As investors began to brace for the eventual move away from stimulus by the ECB, EURUSD began to rally in a theme that lasted into the next year as prices re-tested the 1.2500 level. But that’s where the bullish trend died-out, and as political risks started to re-appear through the Euro-zone, another wave of selling showed in the pair that pushed through the second and third quarters of last year. This pushed EURUSD right back down towards that 1.1212 level, which helped to hold the November low and continues to show support as the door opens into Q2 of 2019.
EURUSD Weekly Price Chart
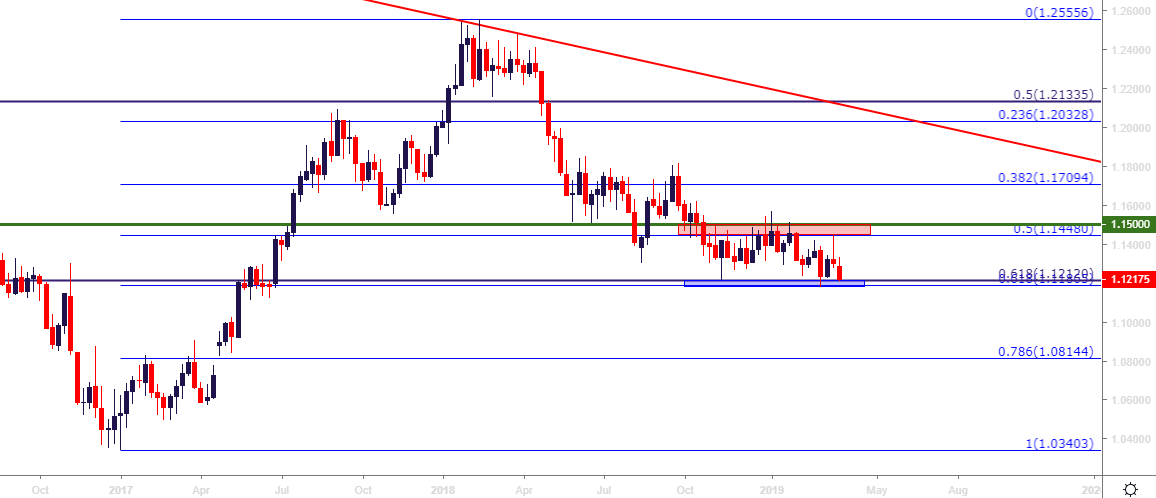
Chart prepared by James Stanley
EURUSD Technical Forecast: Bearish
The 1.1212 level has continued to play out with importance in EURUSD price action. That November swing-low caught support around this area, and that led into yet another range formation; and that’s been building over the past five months.
Amazingly, this five-month stretch of range has seen a number of bearish Euro factors come to light, including: A debt standoff between Italy and Brussels that carried potentially existential implications for the Euro-zone, and an announcement of stimulus exit, which was followed just a few short months later by another announcement of a fresh round of stimulus. Through it all, the range has remained.
EURUSD Daily Price Chart

Chart prepared by James Stanley
For next week, the technical forecast for the Euro will be set to bearish, looking for a downside test below range support as the well-weathered zone faces another series of tests.
Supporting that thesis is an overweight long position via retail traders as shown via IG client sentiment, currently sitting at +2.57, as of this writing. This is an apparent attempt from the retail crowd to look for range continuation, which is somewhat of an oddity as this is a group that will traditionally be swinging for the fences. The fact that they aren’t here makes the bearish case all the more attractive.
Another option for traders looking for short-side exposure in the Euro is the EURJPY cross-pair. This was my chosen candidate to work with that theme coming into 2019. But, more recently, the pair has started to show tendencies of further breakdown; and I looked at short-side setups coming into this week that filled-in to the first target fairly quickly. This can remain as an option for traders that want to look for short-Euro exposure without having to take on risk in or around the US Dollar.
EURJPY Eight-Hour Price Chart
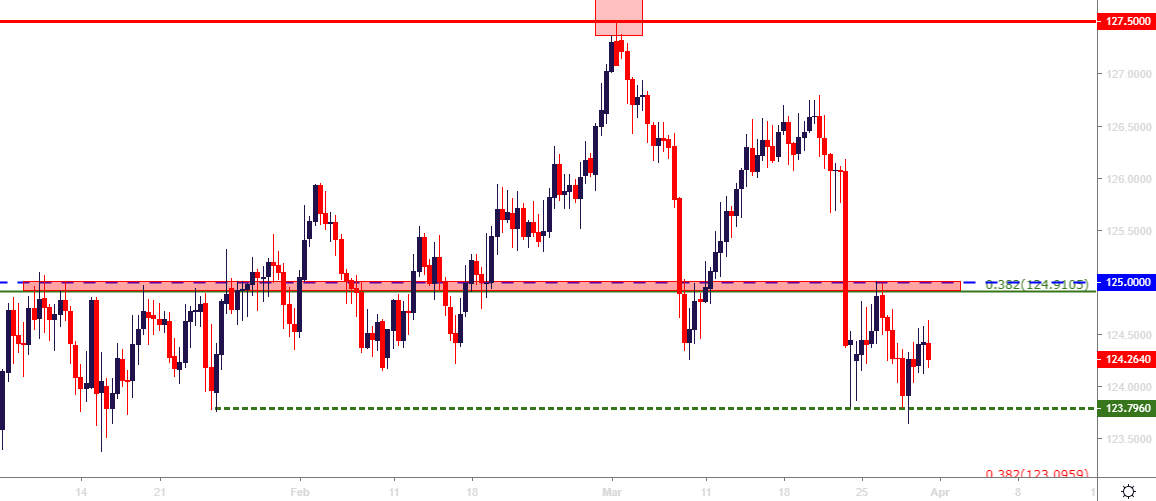
Chart prepared by James Stanley
To Read More:
Are you looking for longer-term analysis on the U.S. Dollar? Our DailyFX Forecasts for Q4 have a section for each major currency, and we also offer a plethora of resources on USD-pairs such as EUR/USD, GBP/USD, USD/JPY, AUD/USD. Traders can also stay up with near-term positioning via our IG Client Sentiment Indicator.
Forex Trading Resources
DailyFX offers an abundance of tools, indicators and resources to help traders. For those looking for trading ideas, our IG Client Sentiment shows the positioning of retail traders with actual live trades and positions. Our trading guides bring our DailyFX Quarterly Forecasts and our Top Trading Opportunities; and our real-time news feed has intra-day interactions from the DailyFX team. And if you’re looking for real-time analysis, our DailyFX Webinars offer numerous sessions each week in which you can see how and why we’re looking at what we’re looking at.
If you’re looking for educational information, our New to FX guide is there to help new(er) traders while our Traits of Successful Traders research is built to help sharpen the skill set by focusing on risk and trade management.
--- Written by James Stanley, Strategist for DailyFX.com
Contact and follow James on Twitter: @JStanleyFX
Other Weekly Technical Forecast:
Crude Oil Prices Edge to 5-Month High, Doesn't Feel Like a 'Breakout'
British Pound Forecast –No Brexit Deal- Pound Losses Mount
US Dollar Forecast – USD Starting to Look Exhausted
Gold Forecast – Gold Price Outlook Bearish in Long Run, Eying Support in Near Term


