


Euro FX-Pairs Technical Analysis
Q1 Trading Forecasts for a wide range of Currencies and Commodities, including EURUSD and EURGBP with our fundamental and technical medium-term technical outlook.
Looking for a fundamental perspective on Euro? Check out the Weekly Euro Fundamental Forecast.
How to Combine Fundamental and Technical Analysis.
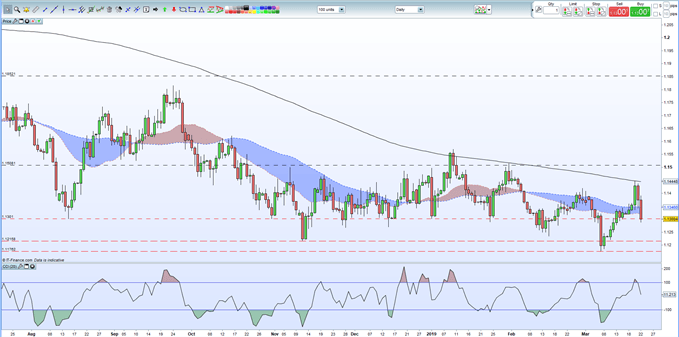
The 200-day moving average refuses to yield to any EURUSD uptick and for the third time this year sent the pair lower after being challenged. EURUSD now trades back below the 20- and 50-day moving averages as well and currently trades either side of the 1.1300 line, and area that prompted rebounds over the last 4-5 months. While this area has been broken before, it remains to be seen if EURUSD will move lower again, especially as Wednesday’s high broke a pattern of lower highs for the first time this year, taking one negative technical indicator off the table. A confirmation that the pair are losing downside momentum would be confirmed if the March 7 low at 1.1176 remains in place, sparking a bullish higher low. Horizontal support kicks-in at 1.1232 (February 15) before 1.1215 (November 12, 2018). Initial resistance between 1.1320 and 1.1350.
EURUSD Daily Price Chart (July 2018 – March 22, 2019)
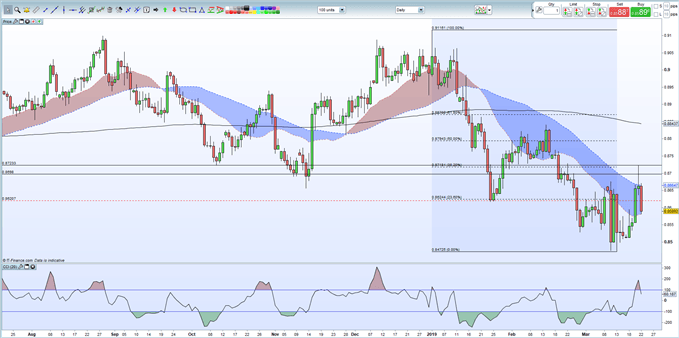
A volatile week for EURGBP, driven by Euro weakness and Brexit news flows. A sharp rally on Wednesday and Thursday was halted by a combination of the 38.2% Fibonacci retracement of this year’s range and to a lesser degree the October 10, 2018 swing-low at 0.8723. The CCI indicator at the bottom of the chart also showed the pair at its most overbought since mid-December 2018. Any further rally will be capped by the Fibonacci level at 0.8718 before the February 14 high and the 200-day moving average come into play around 0.8840. Thursday’s spike high did break the recent set of lower highs and may temper overly bearish sentiment in the short-term. To the downside a break and close below 0.8528 opens the way to a re-test of the 0.8472 multi-month low.
EURGBP Daily Price Chart (July 2018 - March 22, 2019)
How Central Banks Impact the Forex Market
Interest Rates and the Foreign Exchange Market
DailyFX has a vast amount of resources to help traders make more informed decisions. These include a fully updated Economic Calendar, and a raft of constantly updated Educational and Trading Guides
--- Written by Nick Cawley, Analyst
To contact Nick, email him at nicholas.cawley@ig.com
Follow Nick on Twitter @nickcawley1
Other Weekly Technical Forecasts:
Australian Dollar Forecast – AUD/USD Rebound Stalls Post-Fed
Oil Forecast – Evening Star Prints as $60 Breakout Fails
British Pound Forecast – British Pound Volatility Continues and a Break Is Inevitable
US Dollar Forecast – Is FOMC Scared of a Stronger DXY? Apparently So, As They Should
Gold Forecast – Gold Chart Shows Prices Flirting with $1,300 Again After Anti-Risk Bid


