


Sterling FX-Pairs Technical Analysis
Q1 Trading Forecasts for a wide range of Currencies and Commodities, including GBPUSD and EURGBP with our fundamental and medium-term term technical outlook.
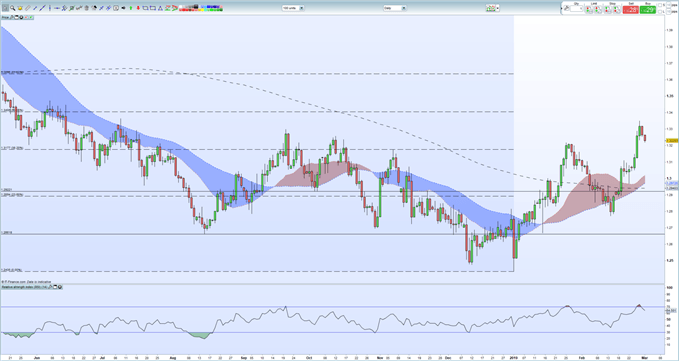
A strong start to the week saw GBPUSD hitting its highest level since July 2018 as positive Brexit sentiment sent Sterling higher across the board. The pair is currently giving back part of this week’s gains but further losses from here looked capped between 1.3177 (38.2% Fibonacci retracement) and 1.3150 (Monday’s high and the bottom of the gap). US dollar strength in the latter part of the week has also helped to pare GBPUSD gains as we head into the weekend. GBPUSD needs to break and close above 1.3300 in a decisive fashion to inject further positive sentiment into the pair, opening up a re-test of 1.3406 (50% Fib).
Looking for a fundamental perspective on GBP? Check out the Weekly GBP Fundamental Forecast.
GBPUSD Daily Price Chart (May 2018 - March 1, 2019)
Becoming a Better Trader – Rules to Trade by | Webinar
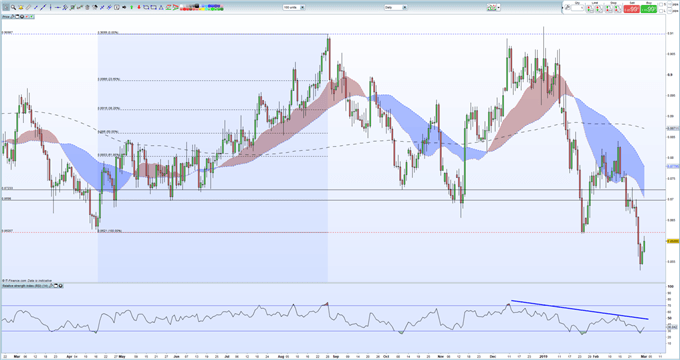
EURGBP broke sharply lower this week, taking out horzontal support between 0.8615 and 0.8621 with ease. The pair traded as low as 0.8530, a level last seen in May 2017 , before turning back towards the 0.8600 area. The RSI indicator highlighted the oversold nature of the pair mid-week and while it is currently moving higher, it remains in a 3-month downtrend. The previously mentioned 0.8620 area may act as initial resistance for any further upside before 0.8698 comes into play. To the downside the longer-term target area is between 0.8382 (May 10, 2017 swing-low), then 0.8325 (161.8% Fib extension) and then 0.8318 (April 18, 2017 low).
EURGBP Daily Price Chart (February 2018 - March 1, 2019)
Interest Rates and the Foreign Exchange Market
DailyFX has a vast amount of resources to help traders make more informed decisions. These include a fully updated Economic Calendar, and a raft of constantly updated Educational and Trading Guides
--- Written by Nick Cawley, Analyst
To contact Nick, email him at nicholas.cawley@ig.com
Follow Nick on Twitter @nickcawley1
Other Weekly Technical Forecast:
Australian Dollar Forecast – GBPAUD Eyes Brexit Referendum Levels. AUDUSD, AUDJPY May Breakout


