


Dollar Talking Points:
- The DXY ended this past week with a moderate break that checks the index back into its range
- FX volatility is suspiciously low while GBPUSD, USDJPY and USDCAD all take swipes at breaks
- See the 1Q 2019 fundamental and technical forecast for the Dollar updated on our trading guides page
Technical Forecast for US Dollar: Neutral
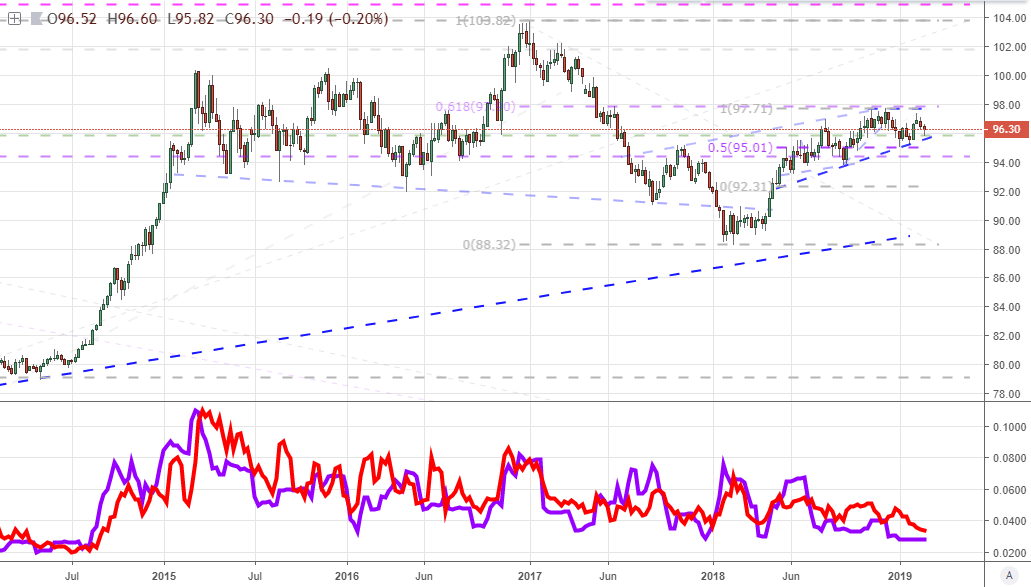
The Dollar looks to be trading in much the same way as its dominant counterparts in other asset classes: cutting momentum short and pursuing technical breaks that require the least conviction from the speculative rank (the path of least resistance in other words). From the DXY Dollar Index, we can see the well-trodden range well – now between the double-top, 21-month high at 97.75 and the progressive support tracking channel support and the 200-day simple moving average at 95.75. The lack of persistent trend is frustrating many traders, but the existence of an overt range should not be overlooked. There are bouts of volatility that accomplish short-term technical breaks that have consistently transitioned to the slow progress of congestion swings. This can produce its fair share of opportunities. Yet, we should also consider this baseline for the Greenback when we see ambitious moves from individual pairs that are attempting to deviate from the norm.
Chart of DXY Dollar Index with 200-Day Moving Average (Daily)

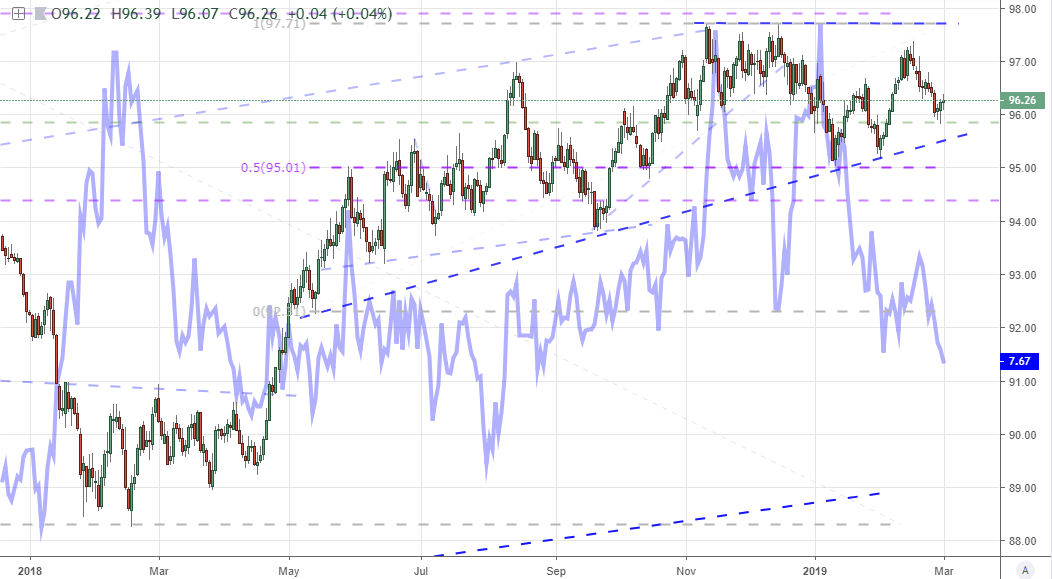
Keeping tabs on the activity level of the world’s most liquid currency, there is little mistaking just how extreme the level of restraint is from the DXY. The historical range for the index over the past 60 trading days (equivalent to three trading months) has flatlined at one of its smallest trading bands since August 2014 - there was a brief interlude in August last year where it saw the smallest range for a few weeks. A narrow corridor does raise the risk of the eventual breakout, but the 200-point breadth for this particular measure (around 300 pips for EURUSD) is wide enough to hold for a few more months should nothing rouse the markets to greater conviction. The measure of medium-term price action in the 20-day (1 trading month) ATR suggests we aren’t facing any serious risk of covering the entire range and breaking through in one fell swoop. This basic activity measure is at its lowest level relative to the same period (summer 2014). What should be noted, however, is that even when the 20-day ATR dropped this low during approximately 5 years ago, it held there only briefly; and we didn’t experience that degree of quiet before that since 1996.
Looking for a fundamental perspective on USD? Check out the Weekly USD Fundamental Forecast.
Chart of DXY Dollar Index with 90-Day Historical Range and 20-Day ATR (Weekly)
With the historical lull in activity, it comes as little surprise that expectations have sunk as well. The correlation between realized and implied volatility is typically fairly high as the appetite to hedge sinks when investors realize they will have to sink money for the insurance. Below, I made an average of the three most liquid pairs’ volatility measures, all calculated by the CBOE. This is the average of the EVZ (EURUSD), BPVIX (GBPUSD) and JYVIX (USDJPY), and we find anticipation for activity at its lowest level since August. That is far less extreme than the historical measures, but remarkable given the pattern the Dollar is carving is ultimately a terminal one (meaning it will run out of room and force a break out of necessity).
DXY Dollar Index and Average of CBOE’s EURUSD, USDJPY, GBPUSD Volatility Indexes (Daily)
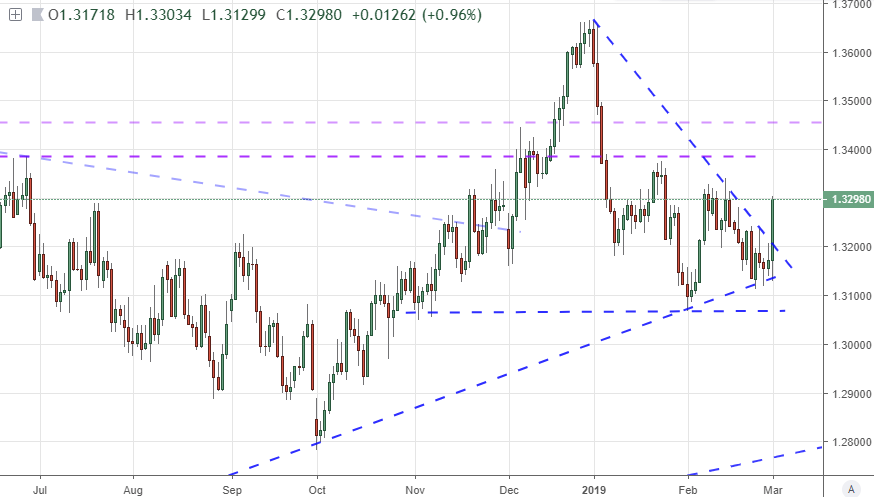
Taking a look around the majors, the EURUSD is the least interesting and the most aligned to the DXY Index. We would need to see that benchmark return to either 1.1500 or 1.1250 before there is real anticipation building again. In comparison, GBPUSD drew considerable speculative attention this past week when its charge pushed the pair briefly above 1.3300. That is a range high dating back to June. The spark for this move was quite clearly Brexit, so it was Sterling-centric. If the fundamental theme kept running, we may have seen real follow through for the Cable, but the charge fizzled and the Dollar’s anchor brought the pair back to heel. The additional volatility here however could make a GBPUSD range a more appealing outlet.
Chart of GBPUSD (Daily)

Another core liquidity member of the Dollar-based majors that has put in for a remarkable move this past week was USDJPY. A three-day charge culminated in a drive to clear the 200-day and 100-day simple moving averages as well as the midpoint to the December 2016-December 2018 range. That is a high-profile break, but its capacity to translate a spark into sustainable trend should come under serious scrutiny given the backdrop from the Dollar and risk trends, not to mention the habits of this pair for starts and stops.
Chart of USDJPY (Daily)

Another major producing a noteworthy technical development was USDCAD. Similar to the Cable, this pair’s charge looks to be more the responsibility of its counterpart than the Greenback itself. A terminal wedge from January’s peak high resulted in a break to follow the ‘path of least resistance’. It would fit the mold fairly well to see this pair shift to a more restrained trading level into next week unless otherwise prompted by a new technical or fundamental catalyst.
Chart of USDCAD
As for speculative positioning behind the FX market’s most liquid player, the CFTC’s Commitment of Traders report on futures positioning is catching up from the partial federal government shutdown. Though still a few weeks behind, it is clear that the unwinding of bullish interest over the past two years was more productive than what we have seen in actual price action itself. The crowd these statistics reflect are more medium-term and concerted in nature, so there may very well be a leading, anticipatory aspect to this slide. In contrast, the short-term reading from the retail group reflected in the IGCS figures (found on DailyFX) show traders are readying for another range flip from EURUSD far short of the 1.1450 or 1.1575 marks that are relative resistance on the past for months of trade.
Chart of Net Speculative Positioning in Dollar Futures Positions from CFTC Report (Weekly)
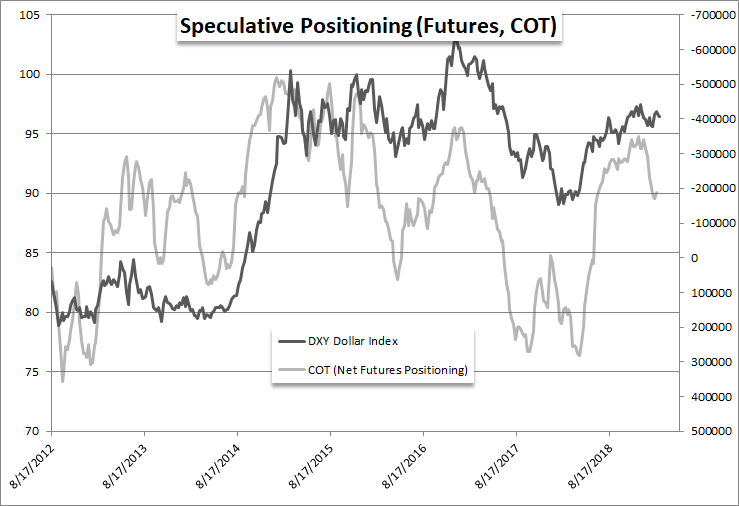
Chart of Retail Trader Positioning from IG Clients (Daily)

Other Weekly Technical Forecast:
Australian Dollar Forecast – GBPAUD Eyes Brexit Referendum Levels. AUDUSD, AUDJPY May Breakout


