


Gold Technical Forecast: Neutral
- Gold prices made attempt to breach immediate resistance towards the end of last week
- XAU/USD fell short of resuming dominant uptrend, reinforcing 1323.60 as resistance
- Watch for fading upside momentum, may place gains at risk. Support at 1302.97 eyed
Find out what the #1 mistake that traders make is and how you can fix it!
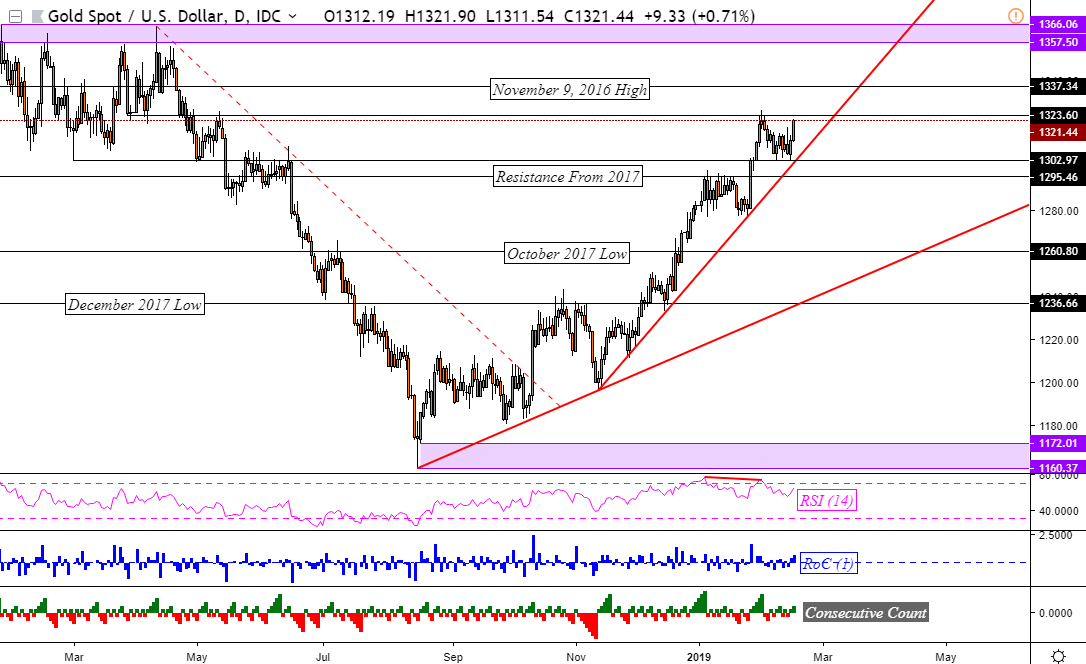
Aside from a small push higher towards the end of this past week, gold prices remained in congestion mode after topping around 1323.60. Gold’s pause under this area occurred with fading upside momentum via negative RSI divergence. The rising trend line from November 2018 held alongside support at 1302.97 (the March 1, 2018 low). Prices were unable to breach 1323.60, further reinforcing it as immediate resistance.
Keep a close eye on RSI next week as XAU/USD may attempt another push above resistance. Fading upside momentum may remerge, undermining progress higher that the anti-fiat commodity may make. A push in that direction exposes the November 9, 2016 high at 1337.34. Ascending through it then exposes a range of resistance between 1357 – 1366.
Meanwhile, near-term support remains the rising support line from November. A descent through it exposes 1295.46 which is former resistance from 2017. Should this area be cleared, the next area of support may halt gold’s descent around 1260.80 which is the October 2017 low.Taking all of this into consideration, the gold weekly technical outlook appears to be neutral.
Looking for a fundamental perspective on Gold? Check out the Weekly Gold Fundamental Forecast.
Gold Daily Chart
Charts created in TradingView
FX Trading Resources
- Having trouble with your strategy? Here’s the #1 mistake that traders make
- See how the Australian Dollar is viewed by the trading community at the DailyFX Sentiment Page
- Just getting started? See our beginners’ guide for FX traders
--- Written by Daniel Dubrovsky, Junior Currency Analyst for DailyFX.com
To contact Daniel, use the comments section below or @ddubrovskyFX on Twitter
Other Weekly Technical Forecast:
Australian Dollar Forecast – AUD/USD Eyes Resistance, AUD/NZD Resumes Fall, GBP/AUD May Bounce
Oil Forecast – The 2019 Crude Bull Market Has Arrived
British Pound Forecast – GBPUSD & EURGBP
US Dollar Forecast – Dollar Within Reach of Two-Year High but Reversal Pressure High


