


Talking Points:
- A 7 consecutive trading day advance for the DXY matches the index’s longest charge in over 2 years
- Like most currencies and asset classes, the Dollar still struggles with commitment
- See the 1Q 2019 fundamental and technical forecast for the Dollar updated on our trading guides page
Looking for a fundamental perspective on USD? Check out the Weekly USD Fundamental Forecast.
Technical Forecast for US Dollar: Neutral
If we were to judge the appeal of a currency from its consistency alone, the Dollar’s charge through this past Friday would mark it as one of the most bullish current moves that we’ve seen from the broader financial market. As of Friday’s close, the Greenback (via the DXY Dollar Index) climbed seven consecutive trading days. That matches similar stretches through October 2018 and December 2017. We haven’t seen a climb longer than this since all the way back in November 2016. That is statistically impressive, but it is not singularly inspiring for subsequent trade developments moving into next week. The trough-to-peak scale of the move was only 1.58 percent – smaller than the 2.3 percent run back in October. That means what momentum we have seen thus far will not overcome its own gravity. And, as far as technical potential goes, all of the climb to this point has not brought us to any critical levels that could set the stage for another strong, sudden acceleration nor for a large swing reversal. There is a 61.8% Fibonacci retracement of the December 14th to January 10th range around 96.70. The more significant resistance would be the convergence of a much larger Fib stake and double top 18-month high at 97.75. Generally speaking, the Dollar is still locked in the middle of its range. That may cater to those that favor range trading, but it will frustrate others who are patiently awaiting larger moves.
Chart DXY Dollar Index with 50-Day and 200-Day Moving Average (Daily)
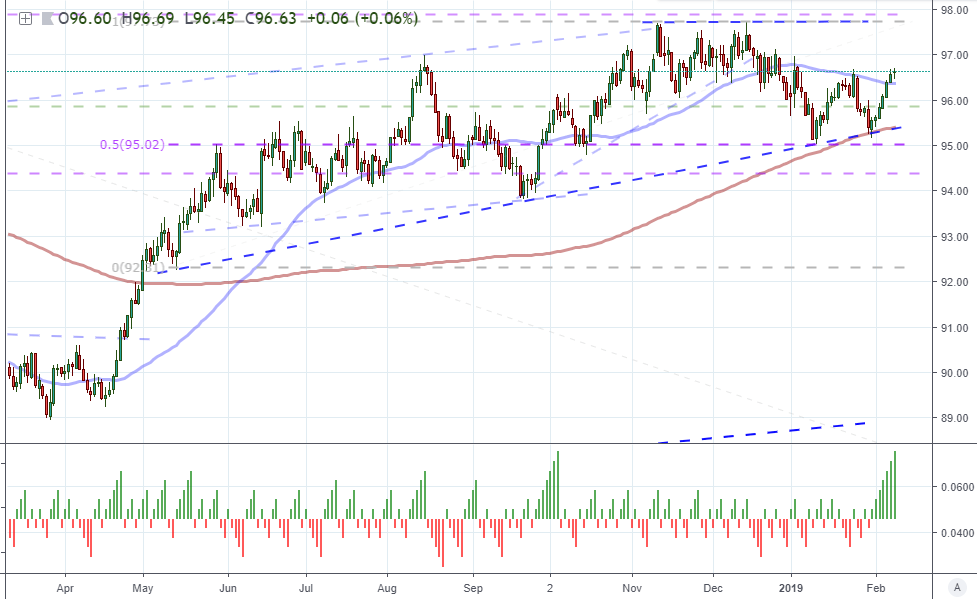
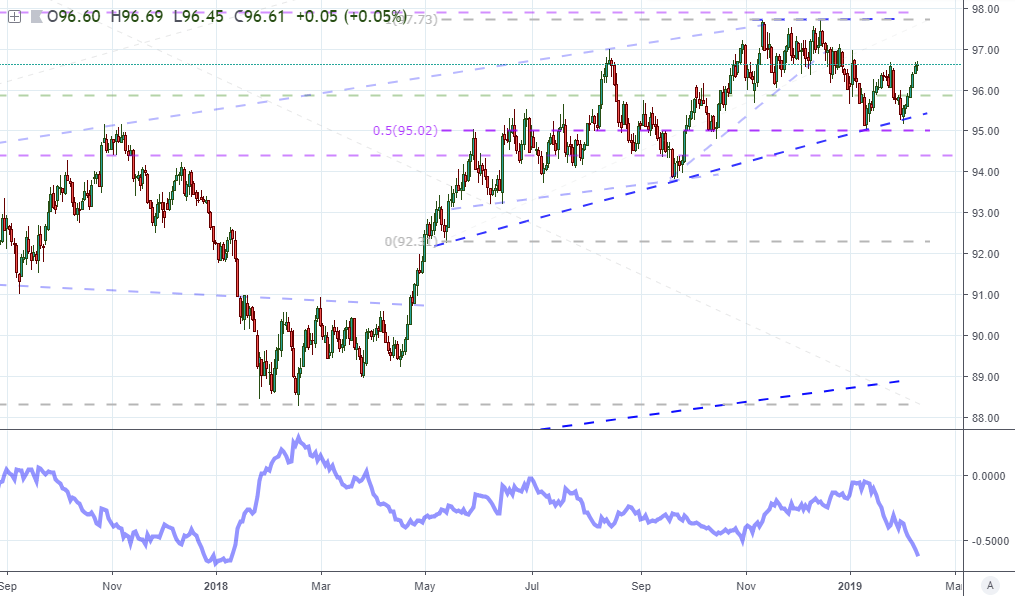
The contrast between the 7-day run thus far to the broader range that we continue to traverse highlights that limited ability of the market to mark key breakouts – much less the establishment of a more serious trend. There is a very gradual bullish bias behind the DXY Index over the past 9 months, but the persistent short-term swings within this plodding advance make for difficult trade for many who prefer the likes of EURUSD. A silver lining, however, is that these measured moves will not continue for much longer. As we discussed over previous weeks, the historical range for this currency is hitting low levels comparable to the extremes seen during the Summer of 2014. Below, the 20-day average true range (ATR) as a measure of the current spot rate is signally a volatility wind up. These readings are extreme, and extremes do not last. They inevitably normalize. One of the very overt threats to a quiet forecast is the abundance of fundamental risks plaguing the markets. From risk trends and Fed policy speculation to trade wars and policy officials’ interest in the exchange rate, there are numerous lines that can be cut to trigger a significant move – and, unfortunately, with little warning.
Chart DXY Dollar Index with 20-Day ATR/Price Ratio (Daily)
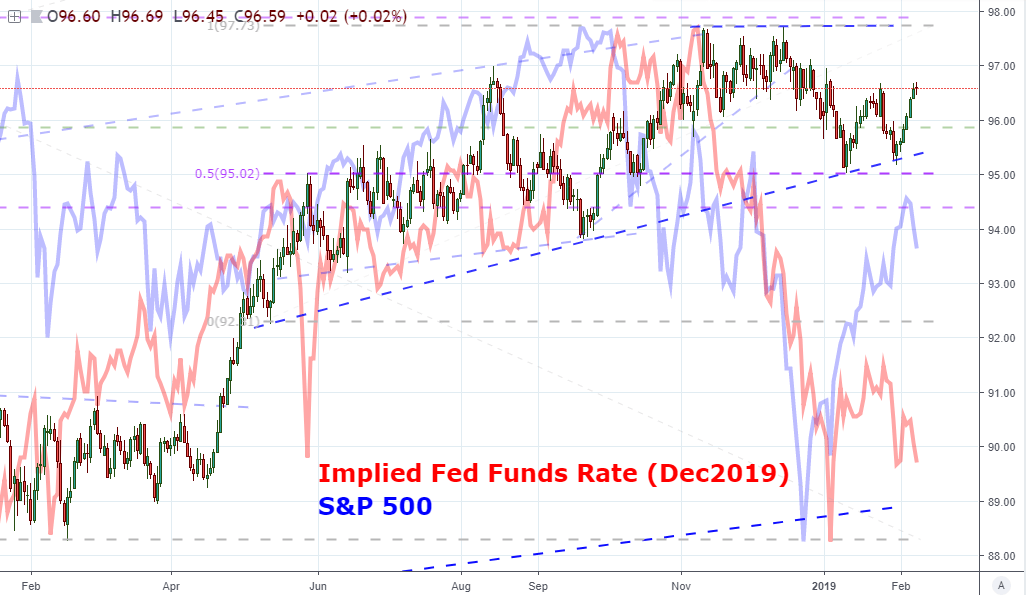
It is worth keeping track of key fundamental themes stirring the Dollar as we await a clear commitment to direction. Don’t worry, you don’t need to interpret headlines and follow the ebb and flow of trade negotiations. The charts can suffice as an important update on what is driving the currency. There are two complementary market measures that are worth following over the coming days and weeks. Monetary policy is a key though convoluted influence for the Greenback. The USD is presently the highest yielding major currency, but markets move as much on forecasts as they do present returns. Therefore, the implied yield derived from the year-end (December 2019) Fed Funds futures contract can give good guidance on this theme. A related consideration is how carry appeal compares to the currency’s renowned safe haven status. The more intense the risk aversion or risk appetite, the more explicit the juxtaposed roles will be for the Dollar. Therefore, the tempo on a sentiment benchmark like the S&P 500 will offer a critical benchmark for direction and tempo.
Chart DXY Dollar Index Overlaid with Fed Funds Implied Rate and S&P 500 (Daily)
Between risk trends and monetary policy, there is systemic reach that stretches far beyond an impact for the US currency. Monetary policy for example has seen a clear shift to the dovish end of the scale these past few months with the European Central Bank (ECB), Bank of Japan (BOJ) and Bank of England (BOE) have all made clear their concern for the economic and financial future. Add to that unique troubles like Brexit uncertainties and persistent on-set deflation and the flight to liquidity leaves only one serious alternative: the Dollar. Yet, the Fed is showing dovish proclivities and is the source of numerous risks of its own (trade wars, economic drudgery owing to political in-fighting); so where does capital move when the four most liquid currencies are all under pressure? Recent history shows there is still a preference for gold. Therefore, when evaluating the DXY or trade-weighted measures of the Dollar, it is further worth checking against the performance of Gold – both in Dollar terms as well as against the other majors (below is gold priced in an index of Dollar, Euro, Pound and Yen).
Chart of Equally-Weighted Gold Index and 50-Day Moving Average (Daily)

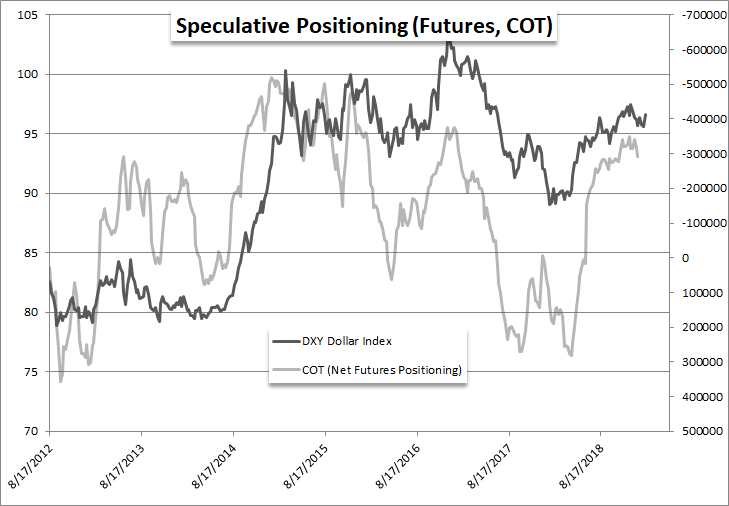
Looking to positioning, retail traders are showing a greater propensity for range trading given recent conditions. The IG client-based sentiment data on DailyFX shows significant swings in net positioning behind EURUSD as the pair has vacillated between 1.1500 and 1.1275. The longer these levels hold, the more comfortable the rank grows about the certainty of a reversal. That breeds a complacency that is familiar from this market group. Meanwhile, the larger speculative traders registered by the CFTC’s Commitment of Traders (COT) report is starting to release backdated figures that were halted during the partial US government shutdown. The data is a month behind with weekly updates due on Tuesday and Friday every week until the data is caught up. For now, the net speculative reading from this report – which is more steadfast and ultimately a better reading of larger trends – is still showing the consolidation at two-year high net-long exposure following the surge over the previous 9 months.
Chart of Net Speculative Positioning in Dollar Futures Positions from CFTC Report (Weekly)
Other Weekly Technical Forecast:
Australian Dollar Forecast - Australian Dollar Strength Falls Apart, Can AUD/CAD Breakout Last?


