


Sterling FX-Pairs Technical Analysis
Looking for a fundamental perspective on British Pound? Check out the Weekly Crude GBP Fundamental Forecast.
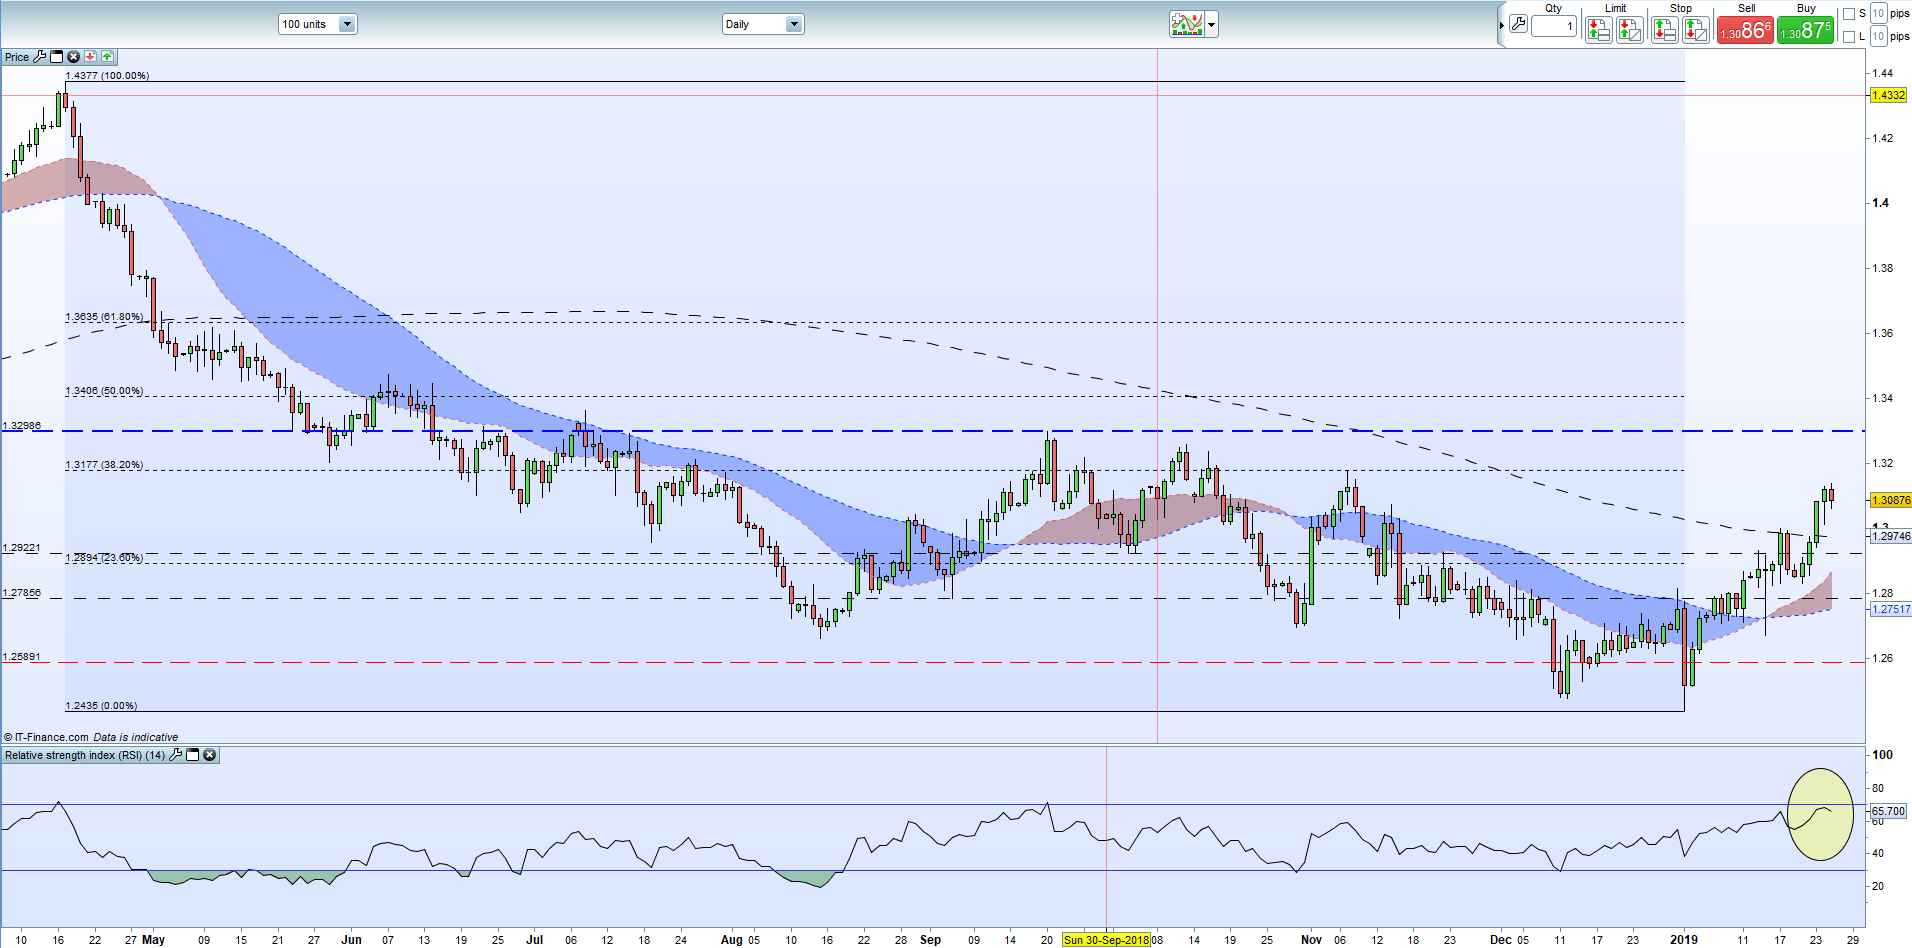
GBPUSD – 200-Day Moving Average Broken, Fibonacci Next
Another positive week for GBPUSD with the 200-day moving average – which had provided a barrier to further upside progress – finally broken and closed above, sending out another positive GBPUSD signal. The pair now near an important level around 1.3175 where the 38.2% Fibonacci retracement meets a previous lower high made on November 7. To completely change the market bias to bullish, GBPUSD needs to trade and close above the September 20 swing-high at 1.32986 (blue dotted line on the chart), breaking the sequence of lower highs and setting up a further run higher. Market is touching oversold condition so a further small pull-back may occur before the market can contemplate further gains.
GBPUSD Daily Price Chart (April 2018 - January 25, 2019)
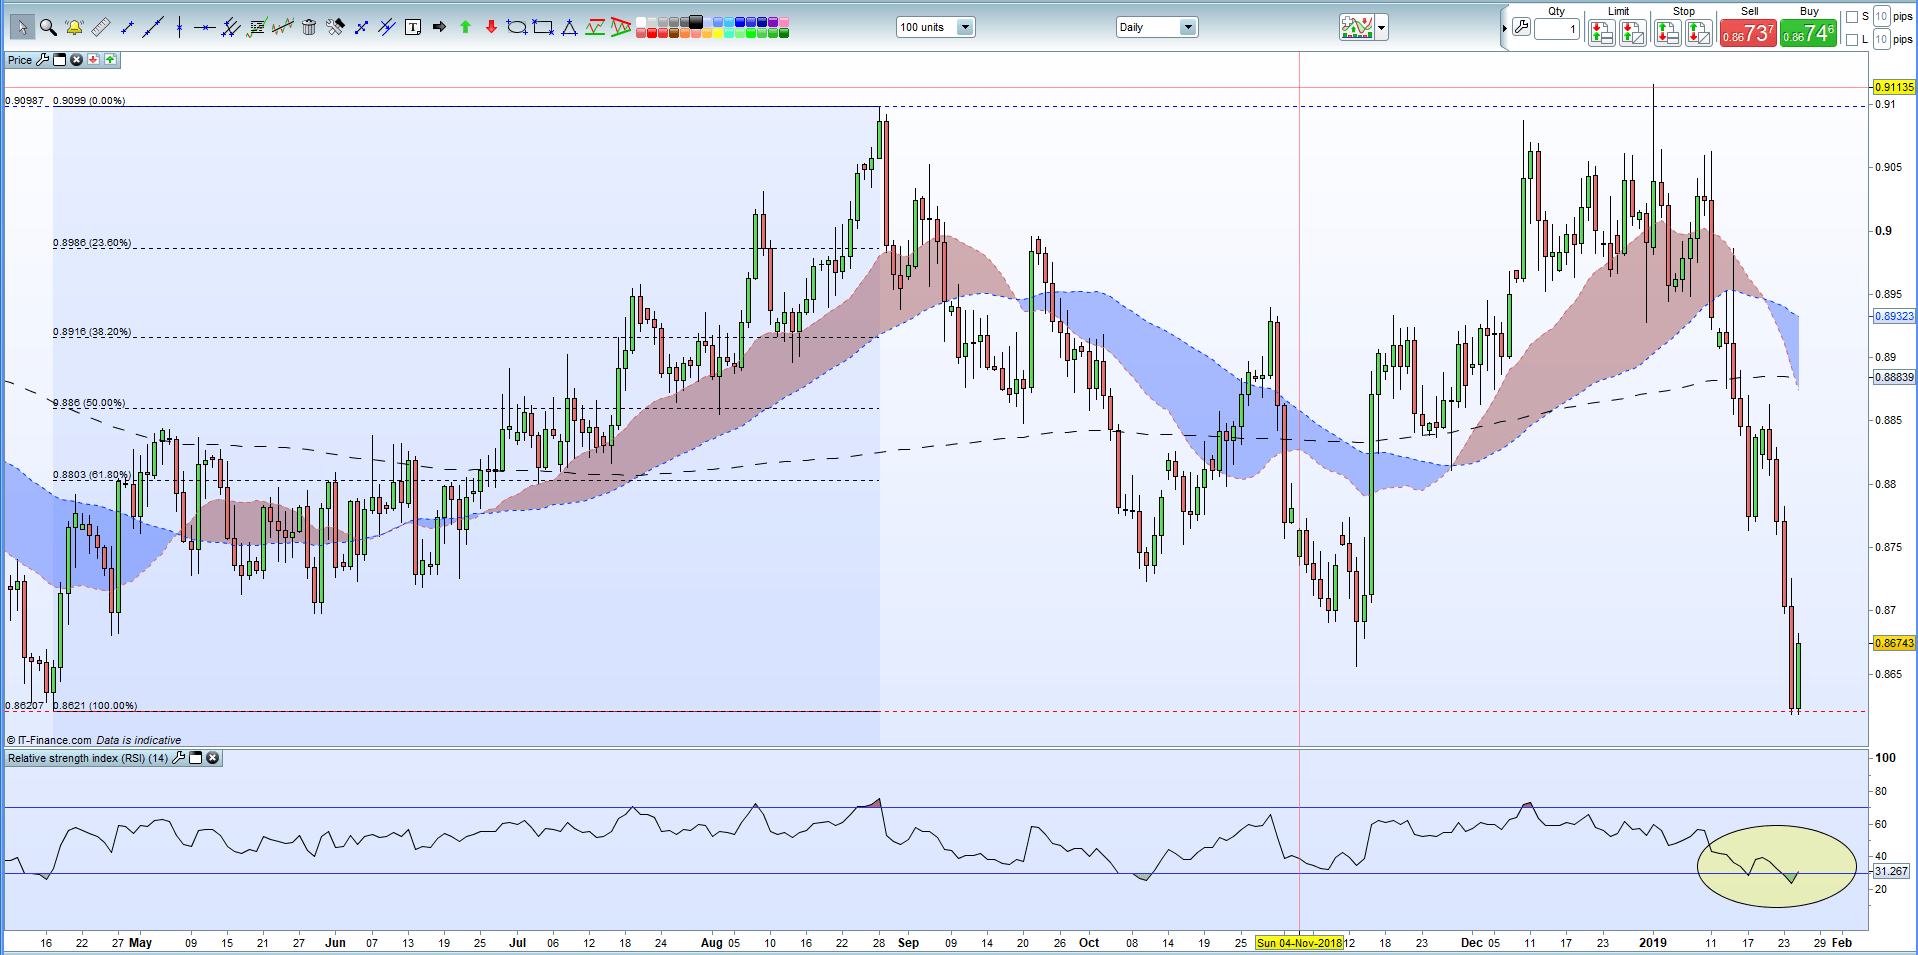
EURGBP Fragile Bounce Off Nine-Month Low
EURGBP has had a tough week, falling sharply all the way back to the April 2018 low before making a minor rebound. The chart below shows the pair moved into oversold territory before the reaction rally but further upside is likely to limited as both technically and fundamentally the pair remains pointed to the downside. There is a gap on the chart from the recent sell-off between the bottom of Tuesday’s candle around 0.8760 and the top of Thursday’s candle at 0.8725 which may provide a target before a further sell-off. The longer-term bias points towards the April 2017 low at 0.8313.
EURGBP Daily Price Chart (April 2018 – January 25, 2019)
Earlier this week we also looked at GBPAUD and GBPNZD and the charts and analysis remain relevant.
--- Written by Nick Cawley, Analyst
To contact Nick, email him at nicholas.cawley@ig.com
Follow Nick on Twitter @nickcawley1
Other Weekly Technical Forecasts:
Australian Dollar Forecast - AUD/USD, EUR/AUD, AUD/JPY Chart Support and Resistance Reinforced


