


Talking Points:
- EURUSD cleared 1.1500 resistance this past week, leading the DXY to drop below 95.75
- Few other majors offer technical position that would trigger a bearish – or a bullish – tipping point
- See the 1Q 2019 fundamental and technical forecast for the Dollar updated on our trading guides page
Technical Forecast for US Dollar: Bearish
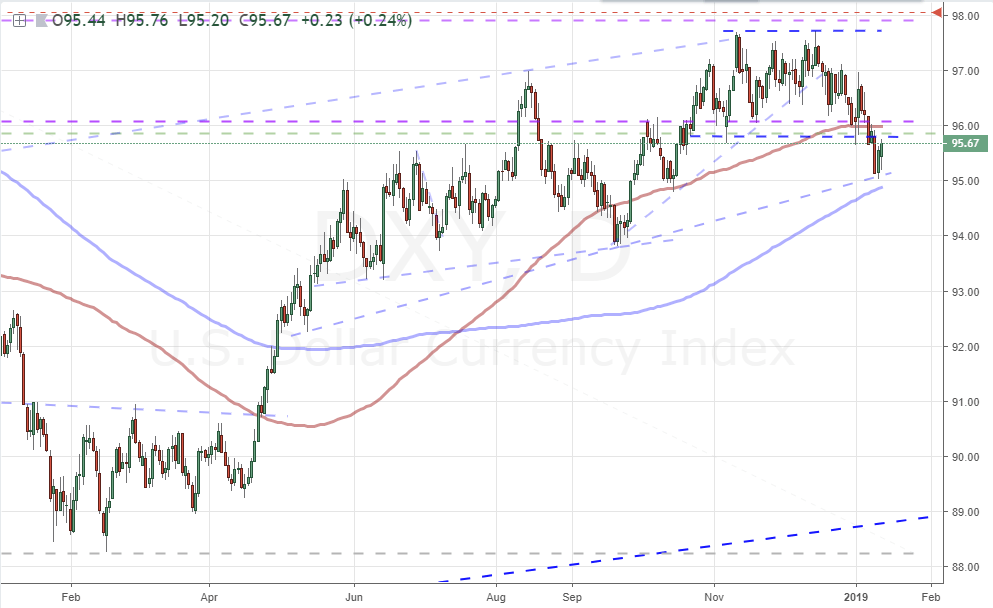
It has finally happened. After two months of messy congestion, the Dollar took out the range support that it had established in a buffer zone between 96.00 to 95.80. Staged at the floor of the range to start the week, a moderately intense selloff Wednesday managed to clear the horizontal support and 100-day moving average. If you pull out to a higher time frame view, this move had also slipped the midpoint of the 2017-2018 range (the purple, dashed lines below) and the midpoint of the 2001-2008 bear wave. There is short-term and long-term heft to the floor we have just cleared, but that does not ensure bears are going to now step on the gas while the bulls throw in the towel. Looking lower, there are multiple technical milestones that we could place emphasis on: an unconfirmed trendline (I need three successful tests) at 95.10; the 200-day moving average at 94.85; the 38.2% Fibonacci retracement of the February to December bull wave at 94.15; and July/September double bottom at 93.80. How influential these levels are depends on how charged the market’s bias is. As it currently stands, there seems to be considerable hesitation in committing to a clear trend; so we should consider both support and resistance levels to hold greater sway over price action than they normally would.
Chart DXY Dollar Index (Daily)
As we noted last week, there was a significant deviation between the 50-day range (as a percentage of price) that the DXY Index had carved out versus the increase in volatility registered in the preceding 20 days. With the borders so narrow, amplified volatility was bound to result in an ‘accident’. We saw that ‘accident’ with the break below support – which in turn slightly increased the scope of the currency’s historical range from its lowest point in four years. However, it doesn’t exactly bring us back to normal conditions. Pulling back even further, the weekly chart (and adjusted 4-week ATR and 10-week range) shows that there is more than just the divergence between the two. We are also dealing with generally low levels in both activity and amplitude that will eventually normalize. That does not necessarily mean that we have to find a critical break and strong trend in the immediate future, but it does suggest we are closer to such a productive run than we have been than any other time in the past three-plus years.
Chart DXY Dollar Index with 4-week ATR and 10-week Historical Range (Weekly)

If you were looking for the specific prompt for the Dollar’s overdue break, it can be attributed to a single pair. EURUSD broke above 1.1500 this past Wednesday to take out its own 100-day moving average and the range top that happens to also qualify as the ‘neckline’ in an inverse head-and-shoulders pattern. Consolidation at the end of prevailing trends is a frequent occurrence, but the progression of a lower low and then higher high to establish a H&S makes for a favorite pattern for technical traders. This former resistance still stands as support to close out the week, but it would not be difficult for price action to slip back below without triggering a more significant bearish run for this pair. And, as lacking as the EURUSD’s technical efforts may be, they were still more impressive than nearly every other Dollar-based major. There were no other critical borders that were being raided to generate a greater swell for the Dollar. This is ultimately the greater restriction on Dollar progress – the lack of a universal bias.
Chart EURUSD (Daily)

If we look at the equally-weighted Dollar Index which I like to refer to in order to get some contrast to the EURUSD-dominated DXY, we find there are still some notable levels which could play a role in stoking speculative interests. A clear support has been established since July and we are putting pressure on it now. The issue however is that traders do not place positions on this synthetic representation of the Greenback but instead they trade in the majors. If momentum returns owing to fundamental considerations – trade wars, the government shutdown, Fed speculation, etc – then the charge could prompt the currency across the board. Technical traders would not have the convenience of a clear break point for pairs like USDJPY, USDCAD, AUDUSD and others; but the momentum would still show up and register on this chart.
Chart of Equally-Weighted Dollar Index (Daily)

I think it is important to keep tabs on speculative positioning through quantitative means rather than indirectly in chart activity to establish a more complete picture of a market. Since the CFTC is not releasing the net speculative futures positioning figures via the COT report due to the government shutdown, we will refer to the retail crowd’s activities. Below is the long, short and net positioning for EURUSD drawn from IG Client Sentiment data. Despite the supposed implications of the pair’s break above 1.1500, there was no sharp increase in long interest nor utter capitulation from the bears. The net balance is still close to even between bulls and bears which suggests they are unsure of any follow through potential. That is unlike the speculative rank as they tend to jump on explicit patterns and overt technical triggers.
Chart of Retail Positioning in EURUSD (Daily)


