


Technical Forecast for Dow, S&P 500, FTSE 100, DAX and Nikkei
Equities Talking Points:
- High Volatility as With S&P 500 and Pound Demands More Regimented Trading.
- DJIA: Dow Jones Tests 25k as Post-FOMC Sell-Off Extends.
- Are you looking for longer-term analysis of Equity prices? Check out our Quarterly Forecasts as part of the DailyFX Trading Guides.
Equity Recovery Remains in Question After Bears Make Another Mark
This week started off on a sour note as sell-offs showed-up again across global equities. The early-November ramp that saw bulls return fell-flat after a big day of selling on Monday, and that pain remained in the early portion of this week as prices peeled away early-November gains. Next week is a bit tricky, as Thanksgiving is on Thursday and US markets will be closed in observance. Friday could be especially tricky, as low liquidity conditions will likely populate global markets, and this can create a slippery backdrop as a number of pensive themes remain in the headlines.
The big push point here appears to be the Fed. US equity prices topped-out around the FOMC meeting earlier this month and, until yesterday, stocks sold off each day since. A bit of support started to show on Thursday and that theme remained through Friday trade; but this is at least somewhat supported by some dovish comments from FOMC Chair, Jerome Powell. The big question at this point is whether that theme will remain and whether equity bulls can continue to push the bid. Below, I parse through these themes while looking at five major equity indices with eyes on next week.
S&P 500 Finds a Bit of Support at 61.8% of 2018 Bullish Move
As looked at last week, the S&P 500 was a bit less bullish than the Dow as price action in the S&P wasn’t yet able to take-out the mid-October swing-high. This gave a lower-high and this helped to keep the forecast at neutral, and prices soon plunged down to fresh November lows and that theme ran all the way into Thursday before a bit of support began to develop off of the 61.8% Fibonacci retracement of the February-September bullish move. While this could eventually help to usher in a bullish backdrop, it’s still too early to make that proclamation much less plan for it; and as such, the forecast will remain at neutral for next week.
Technical Forecast for the S&P 500: Neutral
S&P 500 Daily Price Chart
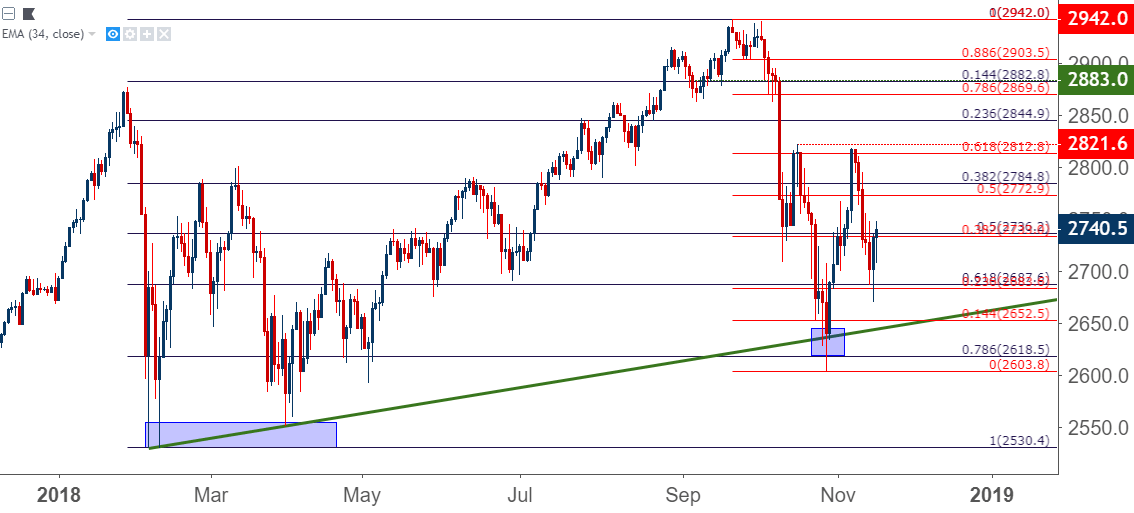
Chart prepared by James Stanley
Dow Bounces from 25k, but Can Buyers Hold the Line?
While the S&P shied away from that prior mid-October swing-high while putting in lower-high resistance, the Dow Jones Industrial Average saw an early-November rally take-out its own mid-October swing-high. This, at the very least, keeps the Dow with a slightly more optimistic backdrop as the more narrow index of blue chip names has held up a bit better as equity weakness has showed more prominently.
It was a similar week of price action in the Dow, in which bears made a big statement on Monday with a bearish theme that lasted into Thursday trade. But prices appeared to cauterize support around the 25k level, and I had published an article looking into the setup entitled, DJIA: Dow Jones Tests 25k as Post-FOMC Sell-Off Extends.
At this point, prices are finding a bit of resistance at a confluent area on the chart around 25,500, as there is both the 38.2% retracement of the 2018 bullish move along with the 50% marker of the October sell-off. To pose an apples-to-apples comparison with the S&P 500, which is holding resistance around the deeper 50% marker of the 2018 move, the Dow would continue to be a more attractive venue for a return of equity strength, and for next week the forecast will remain at bullish.
Technical Forecast for the Dow Jones: Bullish
Dow Jones Daily Price Chart
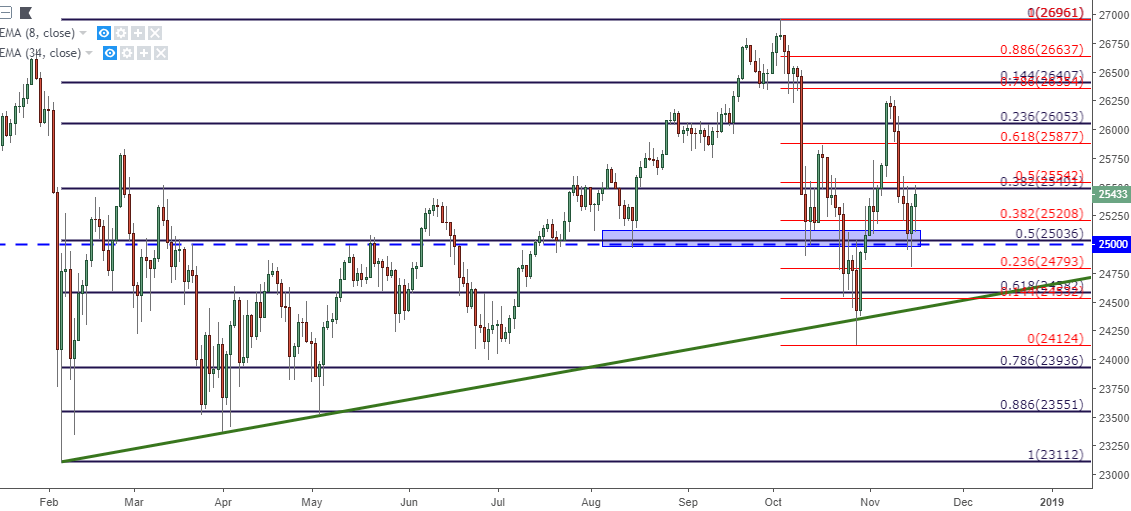
Chart prepared by James Stanley
FTSE 100 Holds Above 7K Despite Mayhem on Brexit
It might be surprising given the dynamics around Brexit this week, but UK stocks have held up fairly well all factors considered. The headlines in British media were absolute mayhem throughout this week, and price action in GBP/USD was somewhat indicative of that with prices bouncing vigorously within a prior range. But, in UK stocks, prices continued to hold above the 7k level. And while not exactly bullish, sellers have been kept at bay over the past few weeks after October price action saw a re-test of the 2018 low at 6850.
A break below that low can re-open the door for bearish strategies but, until then it appears as though there may be more attractive venues to look for weakness in stocks. The forecast for next week will remain at neutral.
Technical Forecast for the FTSE 100: Neutral
FTSE 100 Weekly Price Chart
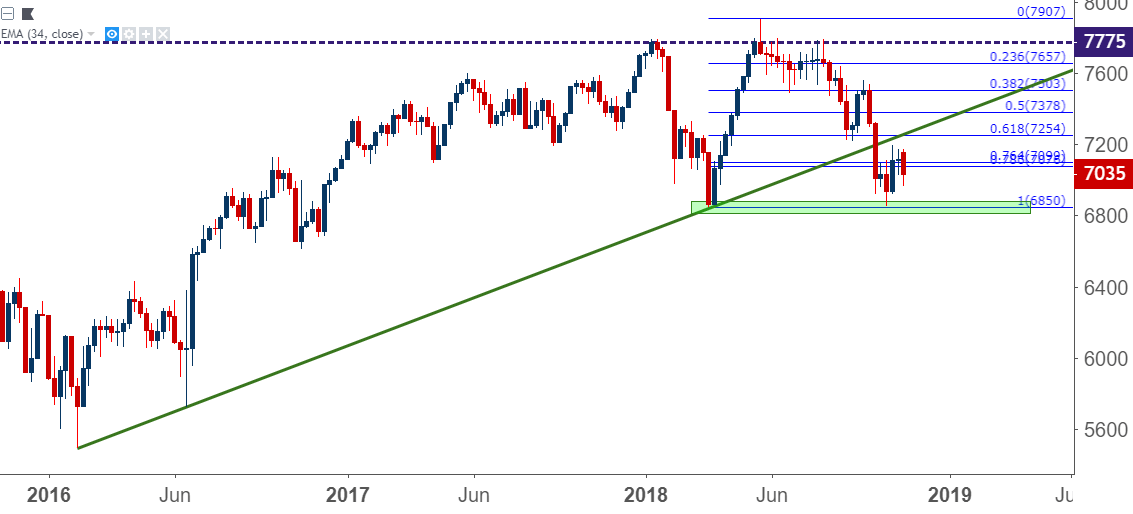
Chart prepared by James Stanley
DAX Reacts to Key Resistance
The DAX has been my choice of venues for equity weakness for a while now, as an indication of oncoming weakness in early-September started to open the door to selling strategies; and that theme has continued to develop as prices pushed down to fresh 18-month lows in October.
As recovery rallies were coming in as last month wound down, resistance started to show in the DAX at a key level around prior support. This is taken from the 38.2% Fibonacci retracement of the 2016-2018 major move, and this is the same Fibonacci study from which the 50% marker helped to set that support last month.
If prices in the DAX can pierce that October swing low, then we will also have a break of the long-term trend-line that connects 2011 and 2016 swing lows, and this can open the door to a longer-term move of weakness that may eventually bring the 10k level back into play. The forecast for next week will remain at bearish.
Technical Forecast for the DAX: Bearish
DAX Weekly Price Chart

Nikkei Sellers Remain as BoJ Gets More Stretched Buying Stocks with QE
This week saw a pretty amazing data point circulating through markets, and that’s the fact that the Bank of Japan’s portfolio has now outstripped the size of their GDP. A large chunk of that QE of the recent past has been directed to equity purchases, both of Japanese and International stocks via ETF’s. And with that fact, it’s somewhat astounding how much weakness has shown of recent given the constant bid pressure that’s come from a pedal-to-the-flor QQE program.
The Nikkei came into September in a very strong way, posing a bullish breakout to fresh 27-year highs. But, that strength soon came into question and as October brought pain to equities the world-around, the Nikkei was unable to escape unscathed and the entirety of that prior breakout was erased, and then some. Earlier this month I initiated a bearish forecast for the Nikkei and that theme gave some run this week as prices pushed below and held resistance around the 22k marker. Support, at this point, has continued to hold around the 23.6% retracement of the October sell-off; but even that feels exposed at this point as buyers haven’t been able to make much of a lasting push despite the hold at this week’s lows. The forecast will remain at bearish for next week.
Technical Forecast for the Nikkei: Bearish
Nikkei Daily Price Chart
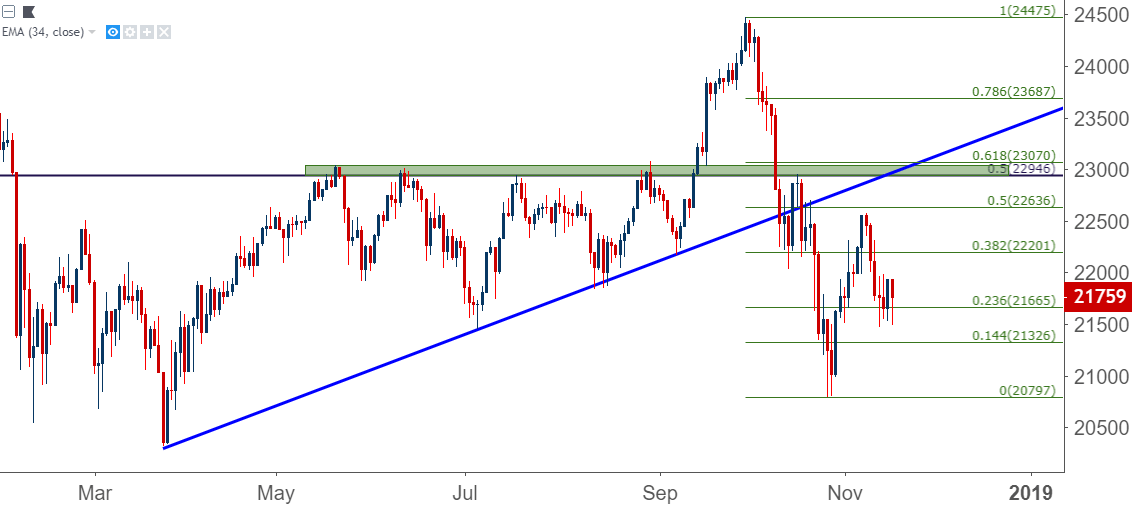
Chart prepared by James Stanley
--- Written by James Stanley, Strategist for DailyFX.com
Contact and follow James on Twitter: @JStanleyFX
Other Weekly Technical Forecast:
Oil Forecast – US Oil Has Three Days of Stability Against Six Weeks and 30% Of Tumble
British Pound Forecast – Sterling Seeks Further Brexit News
US Dollar Forecast – Dollar Leans Towards Important Bearish Breaks, Will Liquidity Save It?


