


Talking Points:
- DXY Dollar Index marked a 16-month high this past Monday, but reversal patters are starting to form
- Liquidity – deflated by the US holiday – will play a key role in determining its ability to forge breaks
- See how retail FX traders are positioning in Dollar-based majors like EURUSD on the sentiment page
Technical Forecast for US Dollar: Neutral
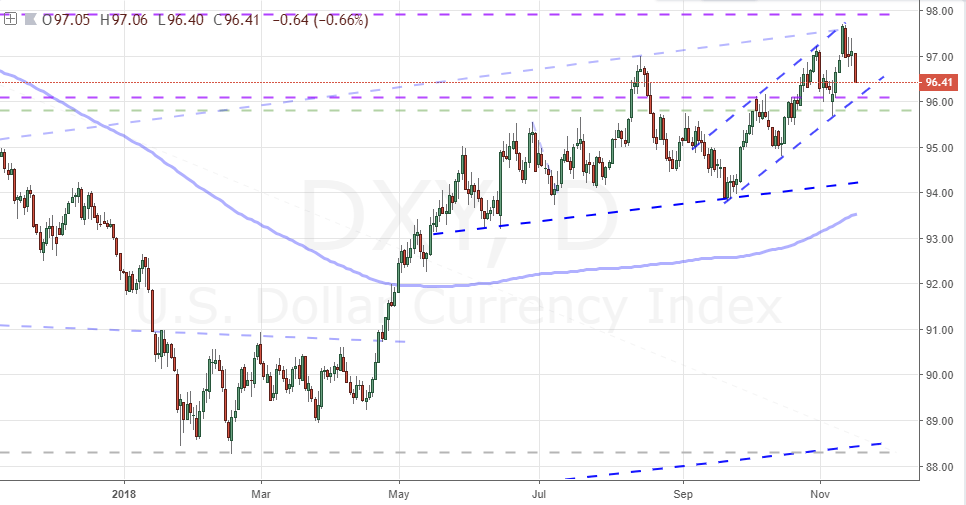
A technical break does not guarantee trend intent. That is something that I like to repeat to myself in order to anchor my expectations in more grounded analysis rather than simply chase the promise of volatility. The Dollar embodied that lesson this past week when the DXY Index and EURUSD charged Monday to the highest level (lowest for EURUSD) since June 2017. The world’s most liquid currency and the most frequently referenced measure for the individual currency signaled a key high, why wouldn’t speculative interests pick up on the move? In reality, if we look to this currency’s habits around previous high-profile technical breaks, we find a pattern of the market’s immediately losing traction after clearing key levels. Good examples are the August charge above 95.65 which at the time stood as the neckline to an inverse head-and-shoulders (H&S) pattern that had formed between July 2017 up until that point. And just to show this is not a directionally-biased reticence, the September slide below 94.75 and/or 94.30 could have qualified as the neckline break of a standard H&S developed over the preceding four month. This currency – like many other benchmarks – simply lacks for definitive conviction.
Chart of DXY Dollar Index (Daily)
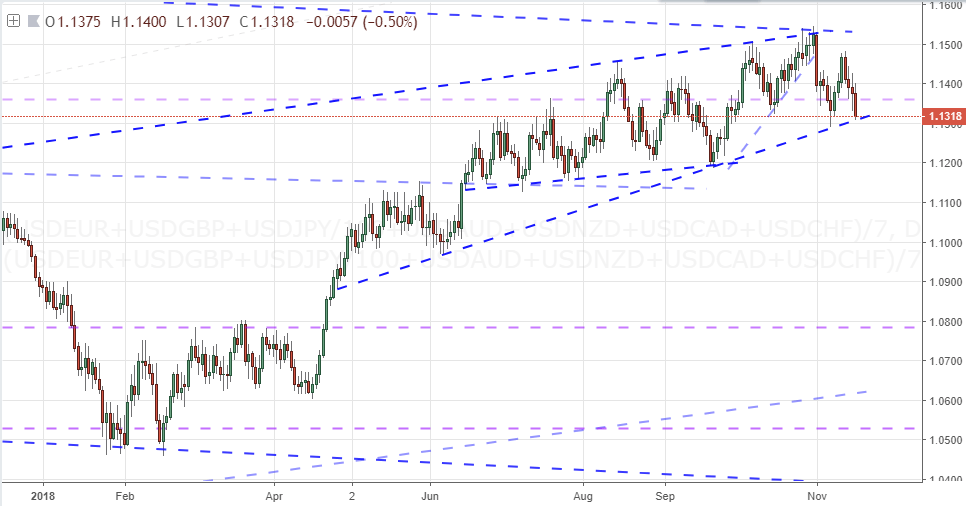
Another handicap in using the DXY – for which I like to adjust – is the excessive exposure it pays to the EURUSD. If we look to an equally-weighted index of the most liquid Dollar-based majors, the speculative leverage insinuated in this past Monday’s move never really showed up. The peak fell with the broader month-long range and held to the rising trend channel formed throughout 2018. In fact, the retreat the currency put in through the rest of the week leverages a more remarkable technical picture towards the bearish end of the scale. As you can see below, there is a standard H&S pattern with a neckline at 1.1300 (the level does not matter here as this is not a tradable asset but rather a representative index). Such a pattern stirs the speculative beast in me, but the same restrictions in market activity should be accounted for regardless of the direction or the measure. If there is a break lower followed by some meaningful follow through next week – insinuating a broad retreat for the currency – I will consider it a stronger and possibly more actionable signal. The problem though is that there is going to be a curb on liquidity and therefore intent ahead.
Chart of Equally-Weighted Dollar Index (Daily)
When a technical break or reversal fails to gain significant traction it usually does so for a few reasons: either the move simple doesn’t excite the animal spirits or there simply isn’t enough of a market to facilitate the move. If there are any efforts to earn a break for the Dollar or any of its primary crosses (EURUSD, GBPUSD and AUDUSD have notable, proximate technical levels) I will immediately process my expectations through an evaluation of market depth. The second half of the coming week will be drained owing to the United States’ Thanksgiving holiday. This is by no means a global event, but the anticipation of a key financial hub being offline nevertheless sidelines speculative ambitions. Also, given its timing in the week, normal activity levels for Friday are deflated and anticipation often sees Wednesday restrained as well. Of course, there is always the possibility that this year may be different. There are plenty of systemically-important fundamental themes skulking around the market and volatility in 2018 has proven prone to repeated, sudden fits. It is worth mentioning that the Dollar has reestablished its positive correlation to activity levels particularly over the past six months. Below, the 20-day (1 trading month) rolling correlation between the DXY and CBOE’s EURUSD Volatility Index has turned strongly positive. That being said, if volatility deflates as usual, it can help facilitate low-intensity bearish range swings for pairs that offer them: GBPUSD and USDCAD in particular but USDJPY could qualify as well.
Chart of DXY Dollar Index, CBOE’s Euro Volatility Index and 20-bar Correlation (Daily)

As we plot out the Dollar’s – and broader market’s – next move, we should look beyond the immediate hurdle for liquidity. In the final week of November and beyond, we are likely to see a higher degree of volume and volatility from the markets than is typical for the ‘holiday’ conditions owing to the unique systemic features of 2018’s landscape. If volatility persists despite expectations, it is likely to leverage an appetite to de-risk. That leaves us in an existential quandary with the Greenback. In such a scenario, would it be a haven as it has been in previous eras or has it imbibed too much from its carry trade status with the Fed’s march of rate hikes? Speculative positioning may help determine at least the medium-term response to a swell in risk aversion. Futures positioning over the past six months has shown an incredible swing from the heaviest net-short position in five years to the most dense net-long exposure in two. That likely puts it at odds to risk trends short of a financial panic – for which the Dollar will offer the most available taps of sheer liquidity.
Chart of Net Speculative Positioning in Dollar Futures Contracts (Weekly)

Other Weekly Technical Forecast:
Oil Forecast – US Oil Has Three Days of Stability Against Six Weeks and 30% Of Tumble


