


Gold Technical Outlook
- Weekly technicals on Gold (XAU/USD) – Price holding well-defined range just below critical resistance
- Check out our 3Q projections in our Free DailyFX Gold Trading Forecasts
- Join Michael for Live Weekly Strategy Webinars on Mondays at 12:30GMT
Gold prices snapped a four-week winning streak with the precious metal off by just 0.11% to trade at 1232 ahead of the New York close on Friday. Despite the loss, prices closed well-off the weekly close with the broader outlook still favoring continued strength. Here are the updated targets and invalidation levels that matter on the XAU/USD weekly chart into November trade. Review this week’s Strategy Webinar for an in-depth breakdown of this setup and more.
New to Gold Trading? Get started with this Free How to Trade Gold -Beginners Guide
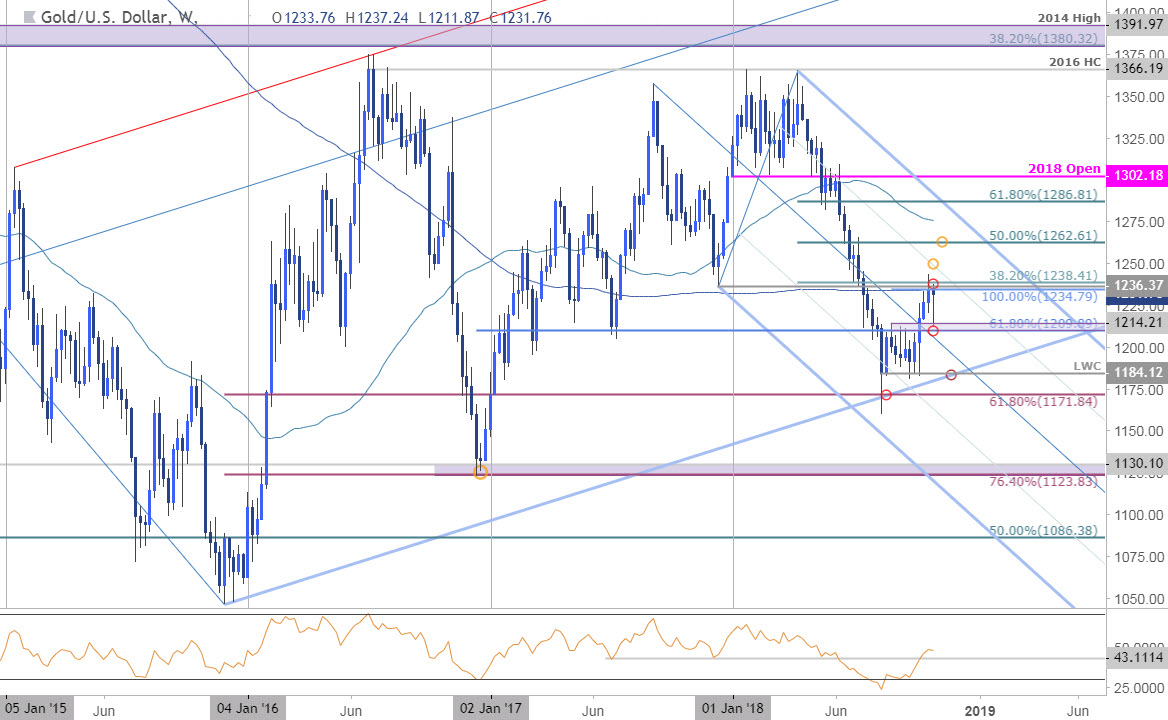
Gold Weekly Price Chart
Technical Outlook:
In our last Gold Weekly Technical Outlook, we noted that prices were testing a critical resistance confluence at 1235/38 with the immediate long-bias at risk while below. Out ‘bottom line’ cited that, “Gold needs to close above 1238 to keep the rally alive. A close below would leave the risk for a pullback heading into the close of the month with such a scenario to offer more favorable long-entries closer to 1210/14.”
A slow grind lower early in the week registered a low at 1211.87 before reversing sharply back into the pivot region we’ve been tracking into the close of the week. IFprice fails here again, the threat remains for a deeper pullback before resumption. The levels remain unchanged from last week with a topside breach targeting the, “75% line (currently ~1250s) backed by the 50% retracement of the yearly range at 1262. Interim weekly support remains at 1210 with broader bullish invalidationsteady at the yearly low-week close at 1184.”
Why does the average trader lose? Avoid these Mistakes in your trading
Bottom line: The immediate advance remains vulnerable sub-1238 but ultimately, a breach is favored. Note that price has already set an impressive November opening-range between well-defined technical levels with the focus on a break of the 1210-1238 zone for guidance. Keep in mind there’s major event risk on tap next week with US Mid-term Elections and central bank interest rate decisions from the RBA, the RBNZ and the FOMC. Trading short-term? Review this week’s Gold Scalp Report for a complete technical breakdown of the intraday trading levels.
For a complete breakdown of Michael’s trading strategy, review his Foundations of Technical Analysis series on Building a Trading Strategy
Gold Trader Sentiment
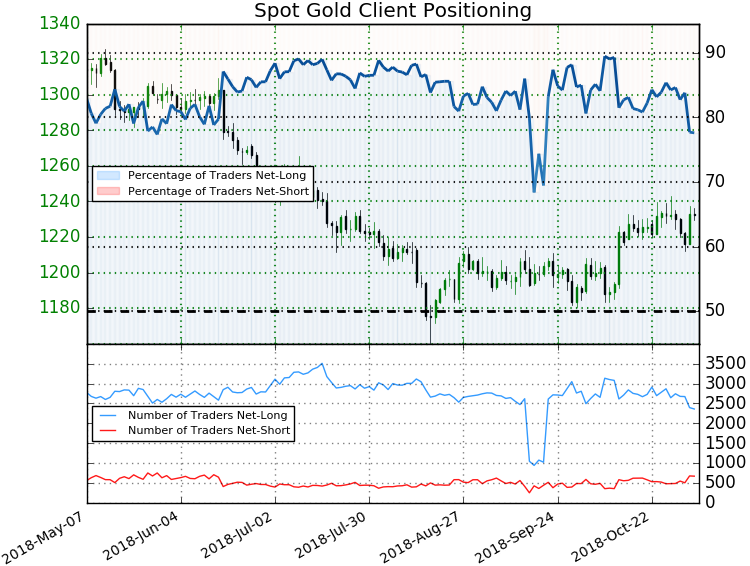
- A summary of IG Client Sentiment shows traders are net-long Gold - the ratio stands at +3.47 (77.6% of traders are long) – bearishreading
- Long positions are 8.0% lower than yesterday and 13.9% lower from last week
- Short positions are 12.7% higher than yesterday and 18.4% higher from last week
- We typically take a contrarian view to crowd sentiment, and the fact traders are net-long suggests Spot Gold prices may continue to fall. Yet traders are less net-long than yesterday and compared with last week and the recent changes in sentiment warn that the current Gold price trend may soon reverse higher despite the fact traders remain net-long.
See how shifts in Gold retail positioning are impacting trend- Learn more about sentiment!
Key Economic Data Releases Next Week
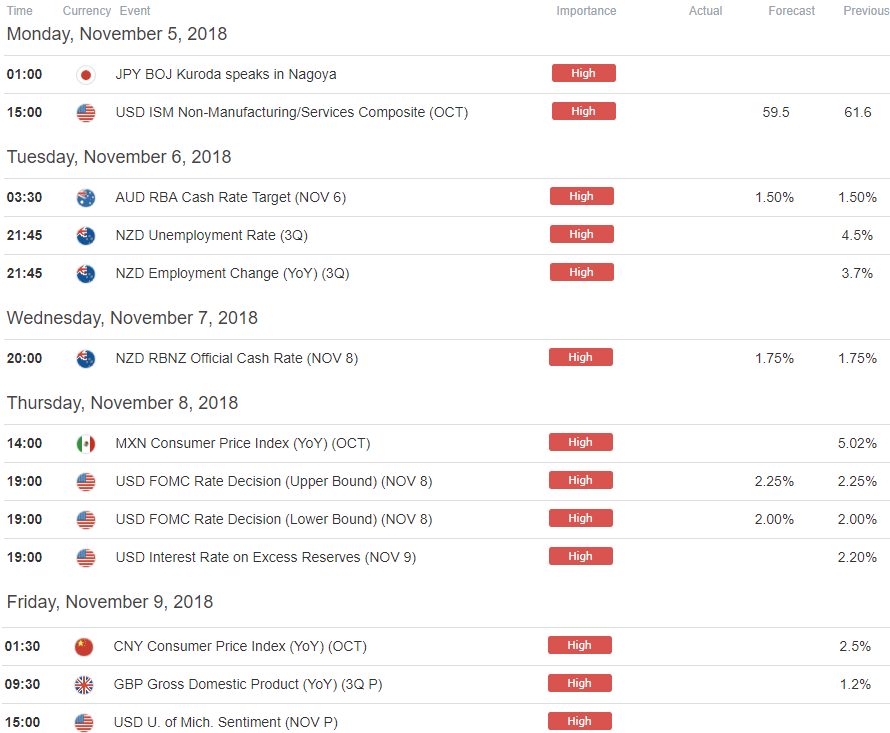
Economic Calendar - latest economic developments and upcoming event risk. Learn more about how we Trade the News in our Free Guide !
- Written by Michael Boutros, Currency Strategist with DailyFX
Follow Michael on Twitter @MBForex or contact him at mboutros@dailyfx.com
Other Weekly Technical Forecast:
Australian Dollar Forecast: AUD/USD, AUD/JPY 2018 Downtrend Under Fire. EUR/AUD Price at Risk
British Pound Forecast: GBPUSD has Mildly Supportive Charts
US Dollar Forecast: Dollar's Breakout Effort Falls Apart and Elections Volatility is Underpriced
Equity Forecast: Technical Forecast for Dow, S&P 500, FTSE 100, DAX and Nikkei


