


GBPUSD Technical Highlights, Prices and Analysis
- GBPUSD Four-Hour chart oversold.
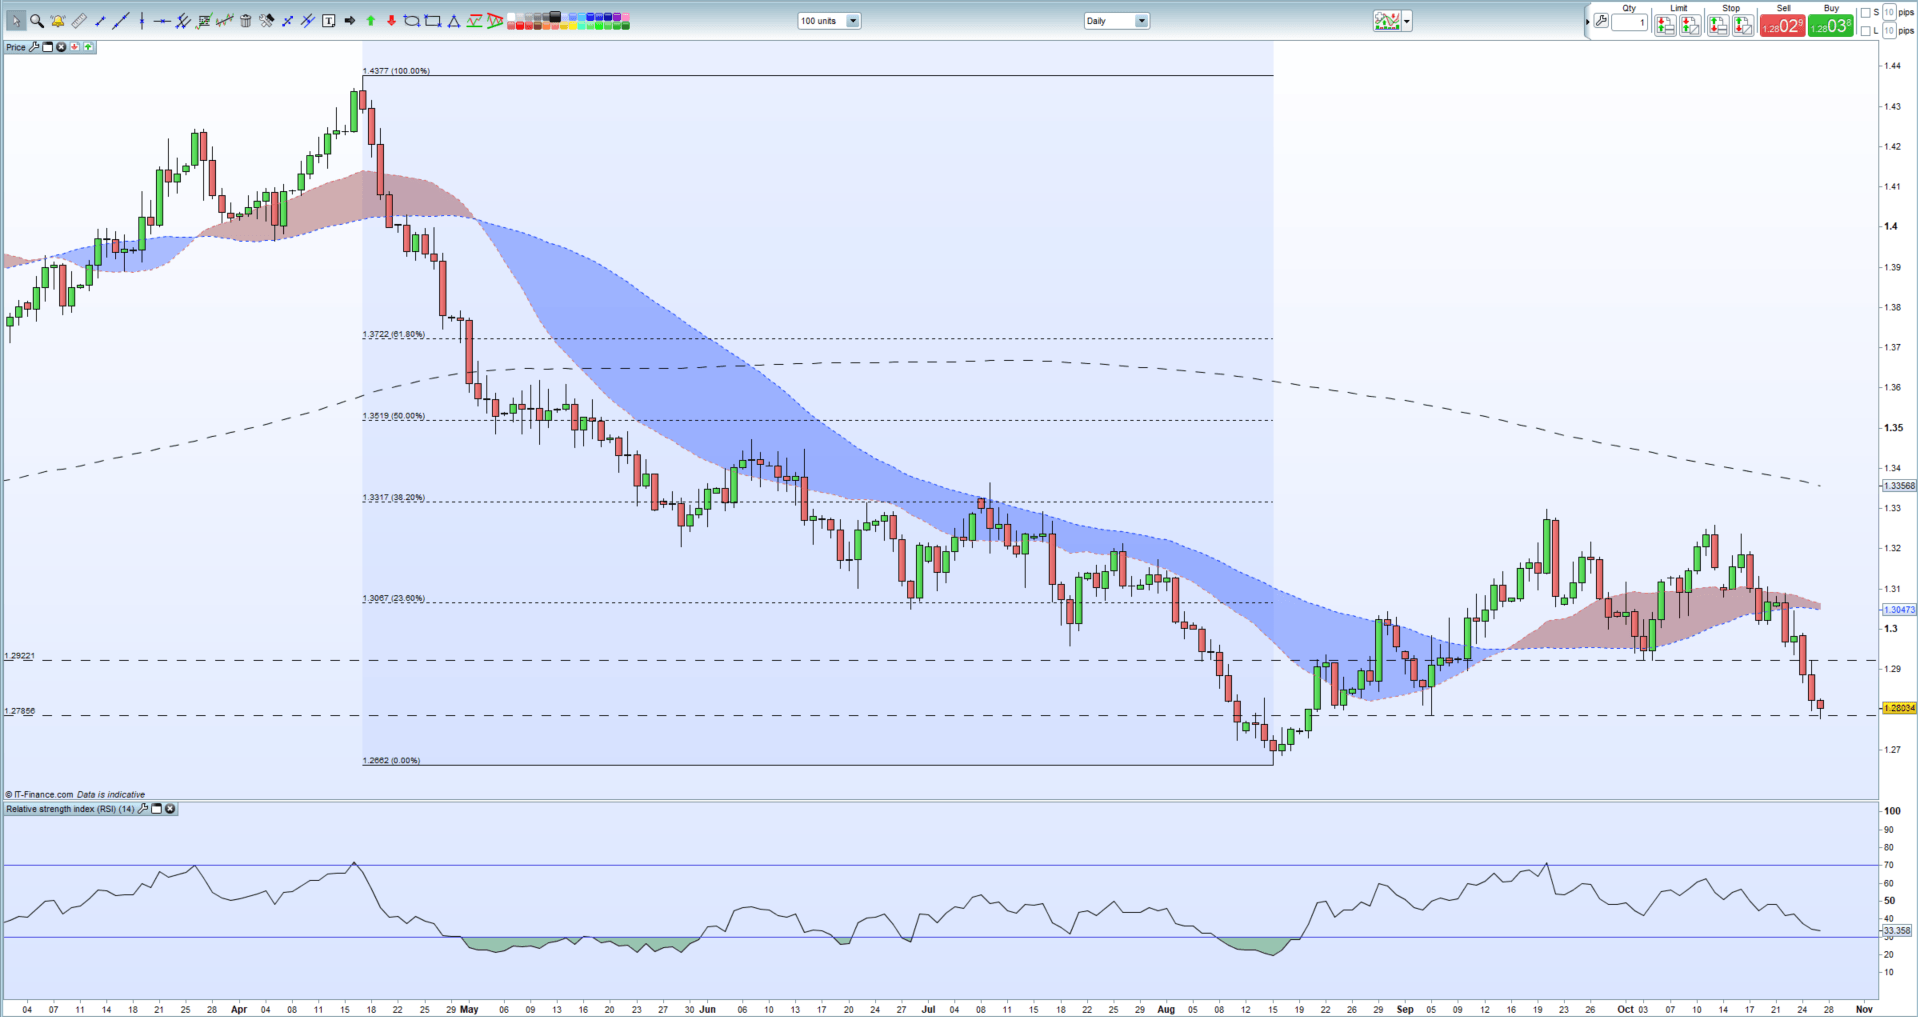
- Daily chart dominated by lower highs and lower lows.
We have recently released our Q4 Trading Forecasts for a wide range of Currencies and Commodities, including GBPUSD with our fundamental and medium-term term technical outlook.
GBPUSD Drops Nearly Three Cents This Week
Cable is down the best part of three cents this week and remains in oversold territory (four-hour chart) but is attempting to rally off its seven-week low. The RSI indicator – at the bottom of the chart – is trying to push out of oversold territory and there remains a possibility that cable may retrace a gap on the chart back to Wednesday’s low at 1.28671. Lower highs remain dominant on the chart and cable needs to break and close above 1.29085-1.29221 to regain a semblance of strength.
GBPUSD Four Hour Price Chart October 26, 2018

The daily GBPUSD chart continues to paint a negative picture with a clear two-week downtrend in place. There are six consequtive lower highs and lower lows in place with Thursday’s candle unable to break back above horizontal support from the double lows made on October 3 and 4. The pair continue to trade below all three moving averages and a close below the September 5 swing-low at 1.27856 will open the way to 1.26620. On the upside, 1.29221 may prove stubborn resistance.
GBPUSD Daily Price Chart October 26, 2018
DailyFX has a vast amount of resources to help traders make more informed decisions. These include a fully updated Economic Calendar, and a raft of constantly updated Educational and Trading Guides
--- Written by Nick Cawley, Analyst
To contact Nick, email him at nicholas.cawley@ig.com
Follow Nick on Twitter @nickcawley1
Other Weekly Technical Forecast:
Australian Dollar Forecast: AUD/USD Price Sets Up for a Rise, GBP/AUD Risks Extending Reversal


