


Gold Technical Outlook
- Weekly technicals on Gold (XAU/USD) – Key resistance in view- constructive while above slope support
- Check out our 3Q projections in our Free DailyFX Gold Trading Forecasts
- Join Michael for Live Weekly Strategy Webinars on Mondays at 12:30GMT
Gold prices rallied for the third consecutive week with the precious metal up more than 0.85% to trade at 1227 ahead of the New York close on Friday. Here are the updated targets and invalidation levels that matter on the XAU/USD weekly chart. Review this week’s Strategy Webinar for an in-depth breakdown of this setup and more.
New to Forex Trading? Get started with this Free Beginners Guide
Gold Weekly Price Chart

Technical Outlook: In our last Gold Weekly Technical Outlook, we highlighted a price breakout above a critical resistance confluence at 1210/14 with the, “first major weekly resistance zone on the topside eyed at 1235/38- a region defined by the 38.2% retracement of the yearly range, the 100% extension of the advance off the August low, the December swing low and the long 200-week moving average.”
Gold registered a high this week at 1233 before turning lower – note that weekly momentum is attempting to close above the 40-threshold for the first time since the June breakdown and bodes well for the bulls. Weekly support rests at 1210 with broader bullish invalidation steady at the yearly low-week close at 1184.
Why does the average trader lose? Avoid these Mistakes in your trading
Bottom line: Our outlook remains unchanged from last week – “Gold prices have cleared a technical resistance confluence / the monthly opening-range high and keeps the outlook weighted to the topside.” That said, prices failed just ahead of key resistance this week and leaves the immediate advance vulnerable near-term while below 1235/38(could see a tag of this level first). From a trading standpoint, looking for a pullback to offer more favorable entries while above the median-line with a topside breach targeting the upper 50-line (currently ~1250s) and the 50% retracement of the yearly range at 1263. Trading short-term? Review this week’s Gold Scalp Report for a complete technical breakdown of the intraday trading levels.
For a complete breakdown of Michael’s trading strategy, review his Foundations of Technical Analysis series on Building a Trading Strategy
Gold Trader Sentiment
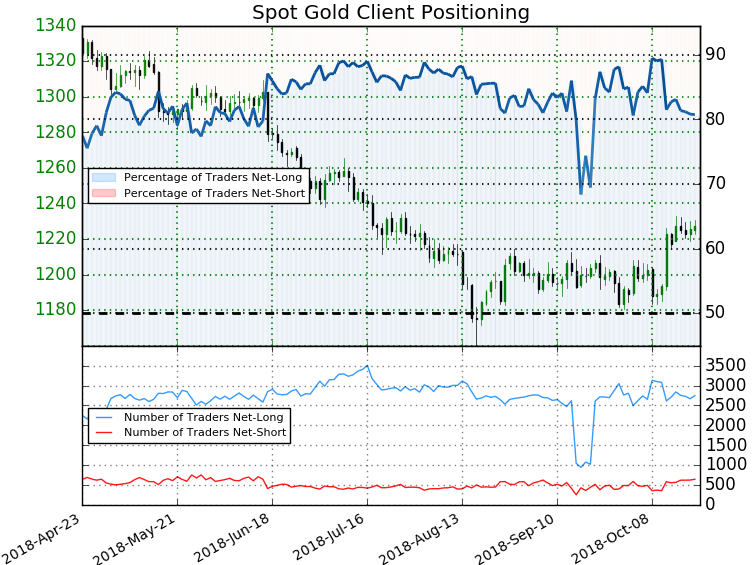
- A summary of IG Client Sentiment shows traders are net-long Gold - the ratio stands at +4.19 (80.7% of traders are long) – bearishreading
- Long positions are1.2% lower than yesterday and 2.1% higher from last week
- Short positions are 5.8% higher than yesterday and 9.7% higher from last week
- We typically take a contrarian view to crowd sentiment, and the fact traders are net-long suggests Gold prices may continue to fall. Yet traders are less net-long than yesterday and compared with last week and therecent changes in sentiment warn that the current Gold price trend may soon reverse higher despite the fact traders remain net-long.
See how shifts in Gold retail positioning are impacting trend- Learn more about sentiment!
Key Economic Data Releases Next Week
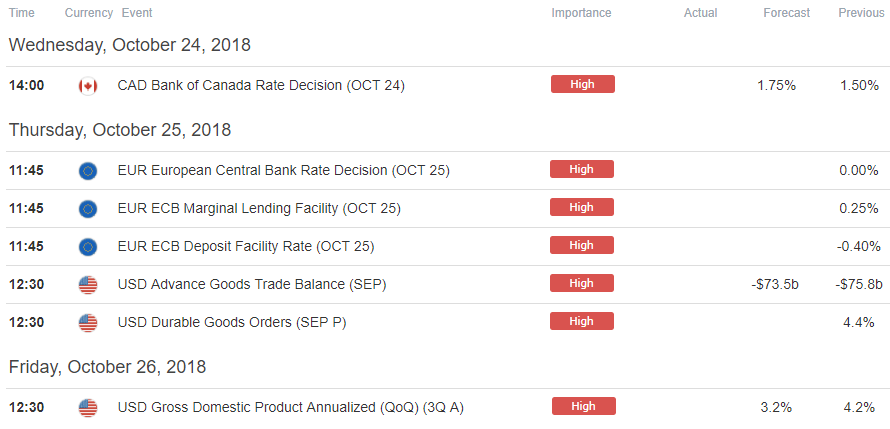
Economic Calendar - latest economic developments and upcoming event risk. Learn more about how we Trade the News in our Free Guide !
Learn how to Trade with Confidence in our Free Trading Guide
- Written by Michael Boutros, Currency Strategist with DailyFX
Follow Michael on Twitter @MBForex or contact him at mboutros@dailyfx.com
Other Weekly Technical Forecast:
Australian Dollar Forecast: AUD/USD in Consolidation. GBP/AUD Risks Reversal, AUD/NZD More so
British Pound Forecast: Higher Prices Unlikely
US Dollar Forecast: Can the Dollar Draw from EURUSD, USDJPY to Return to 15 Month Highs?
Equity Forecast: Technical Forecast for Dow, S&P 500, FTSE 100, DAX and Nikkei
Euro Forecast: Euro Biased Lower But Weekly Chart Shows Warning Sign for Sellers


