


GBPUSD Technical Highlights, Prices and Analysis
- GBPUSD 1.3000 holds two attempts.
- Four lower highs are ominous.
We have recently released our Q4 Trading Forecasts for a wide range of Currencies and Commodities, including GBPUSD with our fundamental and technical outlook.
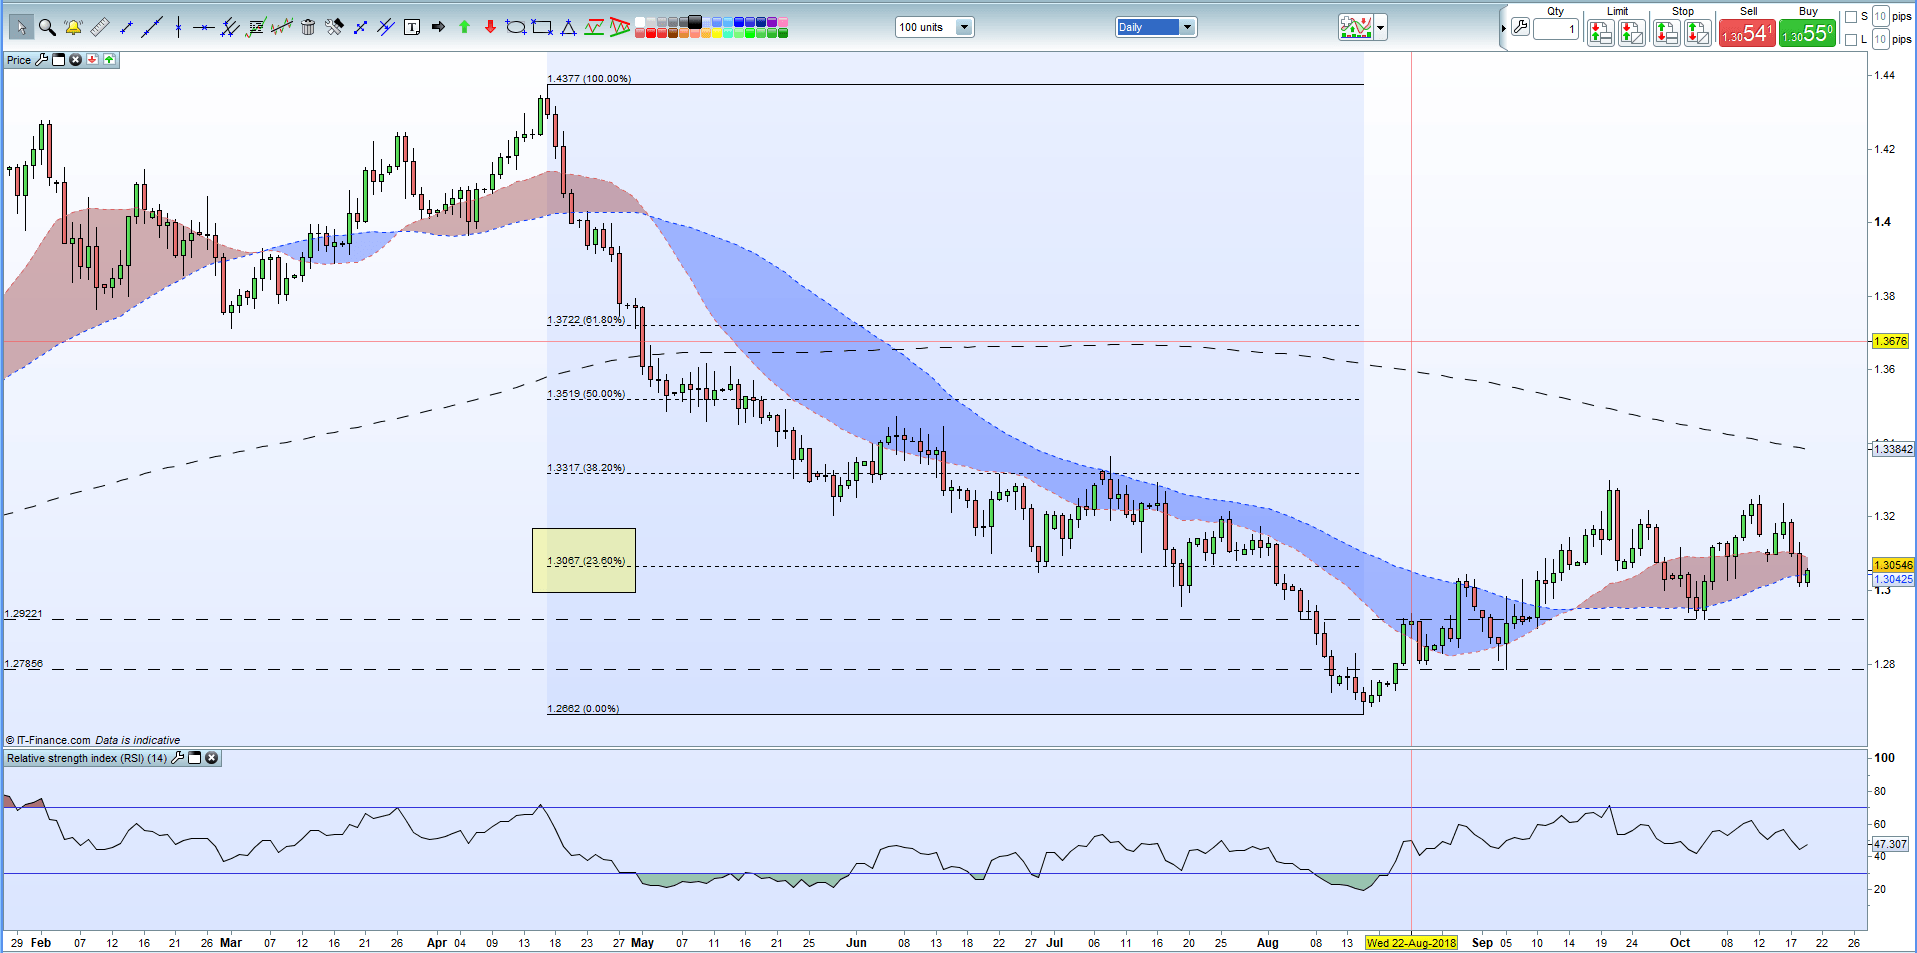
Short-Term GBPUSD Chart – Upside Potential Limited
This week’s break lower has taken GBPUSD below all three moving averages and paints a negative picture for the pair. Potential upside is guarded at 1.3086 (200-day) ahead of 1.3128 (20-day) and 1.31495 (50-day). The RSI indicator has turned higher just before falling into oversold territory and may indicate a short-term bounce to the 200-day level noted above. A break below 1.3000 would open the way to the recent low at 1.2922.
GBPUSD Four Hour Price Chart October 19, 2018

GBPUSD made two attempts at the end of the week to break through 1.30000 but failed both on both occasions. The chart also shows the last four candles with lower highs, a negative, while Fibonacci retracement at 1.3067 may offer a limited resistance. If 1.3000 is broken, support at 1.2922 should prove robust in the short-term, ahead of 1.27856. Bullish momentum will find resistance at 1.3258 ahead of 1.32986, with the latter unlikely to be broken until the fundamental backdrop changes.
GBPUSD Daily Price Chart October 19, 2018
DailyFX has a vast amount of resources to help traders make more informed decisions. These include a fully updated Economic Calendar, and a raft of constantly updated Educational and Trading Guides
--- Written by Nick Cawley, Analyst
To contact Nick, email him at nicholas.cawley@ig.com
Follow Nick on Twitter @nickcawley1
Other Weekly Technical Forecast:
Australian Dollar Forecast: AUD/USD in Consolidation. GBP/AUD Risks Reversal, AUD/NZD More so


