Talking Points:
- The Japanese Yen was the best performing major currency last week as global equity markets were slammed.
- A sign of things to come? Gold broke its downtrend from the April and June highs; when Gold outperform, it’s typical for the Yen to as well.
- Retail traders continue to sell the Yen on rallies, suggesting that price gains are likely in the near-term.
See our long-term forecasts for the Japanese Yen and other major currencies with the DailyFX Trading Guides.
Technical Forecast for the Japanese Yen: Bullish
The Japanese Yen was one of the beneficiaries during the global equity market selloff last week, posting gains against every major currency en route to its best week of the year since mid-February: CAD/JPY led the pack down, falling by -1.97%, and is now down -2.19% in October; and USD/JPY dropped by -1.33% and is now down by -1.31% on the month overall. Halfway through the month, the worst performing in October is NZD/JPY, off by -2.98%.
The acute deterioration in risk appetite across the board has reignited interest in safe haven assets – not just the Japanese Yen. Gold had its best week in nearly two-months, while the US Treasury yield curve actually flattened amid a steeper drop in long-end yields than their short-end counterparts.
The fact of the matter is that we may have crossed the Rubicon with respect to how investors view the global risk landscape. The aggregate stress of tightening monetary policy, mismanaged fiscal policy (rising deficits), trade wars, high oil costs, and high inflation may be proving too much for market participants at present time. If so, it’s a combination of concerns that stands to benefit the Japanese Yen.
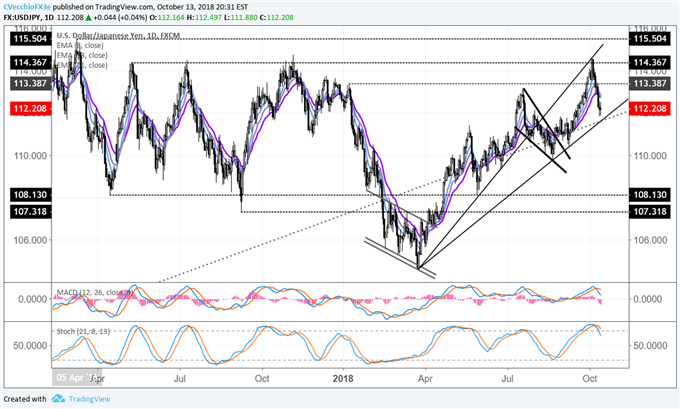
USD/JPY Price Chart: Daily Timeframe (February 2017 to October 2018)

Failure to retake the uptrend from the March, May, and June lows proved dramatic, as the retest occurred near 114.37, the beginning of a resistance band that capped USD/JPY advances in May, July, October, and November 2017. Losses have accumulated quickly, and now two more uptrends, more significant than the last, are threatening to give way: the uptrend from the March, August, and September lows; and the longstanding uptrend from the swing lows in 2012 and 2016 (the Bank of Japan’s Kuroda’s trendline). This confluence of support comes in near 111.60 over the coming days.
Below 111.60, the chart goes from bad to worse for USD/JPY. The situation is already looking weak, with price below its daily 8-, 13-, and 21-EMA envelope. Bearish momentum is building, with both the daily MACD and Slow Stochastics having turned lower and quickly moving away from overbought bullish conditions. For now, rallies should be sold; only a return back above 113.39 would warrant a more optimistic outlook.
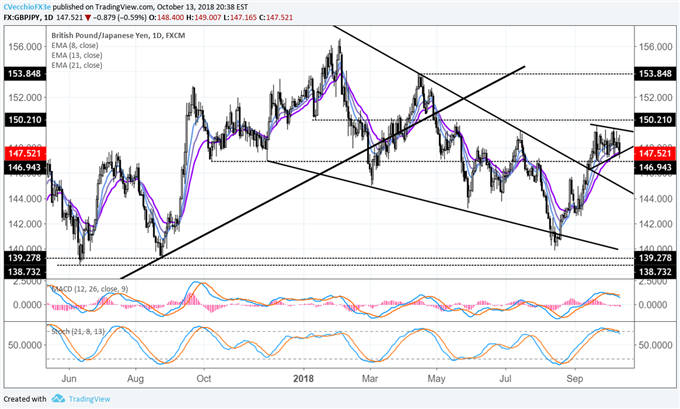
GBP/JPY Price Chart: Daily Timeframe (May 2017 to October 2018)

GBP/JPY’s breakout in early-September looks vulnerable after failure to progress over the past three weeks. In fact, the symmetrical triangle in place since September 14 has already broken to the downside, coinciding with price closing below its daily 21-EMA for the first time since September 6. A key inflection point is on the horizon near 146.94, which produced significant reactions in October and November 2017, and March, May, August, and September 2018.
Below 146.94, the September 14 low at 146.40 should be of interest before the late-August swing high of 145.69. If bearish momentum does not continue to develop, traders may want to stay away from GBP/JPY, which would likely then be back in its sideways consolidation.
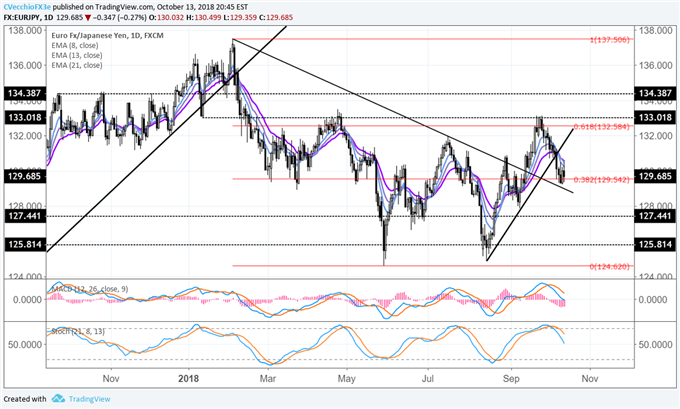
EUR/JPY Price Chart: Daily Timeframe (September 2017 to October 2018)

EUR/JPY is increasingly looking like it is in trouble moving forward, having broken the uptrend from its August, September, and early-October swing levels. Bearish momentum has continued to develop, with price holding below its daily 8-, 13-, and 21-EMA envelope. At the same time daily MACD and Slow Stochastics have turned lower and moved away from overbought conditions (with the latter nearly below its median line).
The last line of defense appears to be the 38.2% retracement of the 2018 range (February high to May low) at 129.54. Failure here would see a return back to the descending trendline from the February and July highs near 128.80, then the mid-September swing low at 127.87.
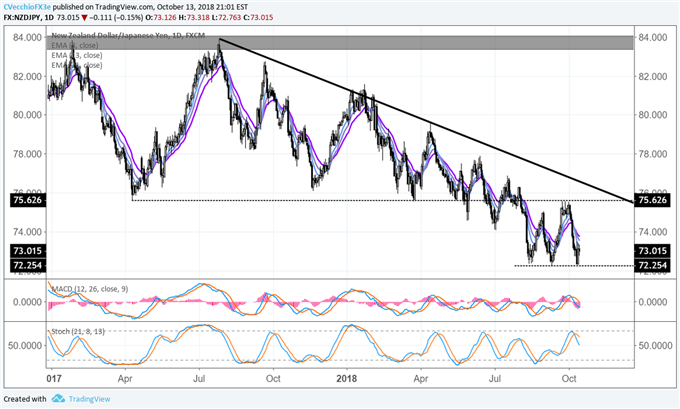
NZD/JPY Price Chart: Daily Timeframe (January 2017 to October 2018)

The worst performing pair in October, NZD/JPY may be on the verge of more weakness. Losses have been acute through the first half of the month, but the fact is that price has been mired between 72.25 and 75.63 for nearly three months. That said, a technical breakdown from here would be significant, and bearish momentum is building in said fashion. Price is below its daily 8-, 13-, and 21-EMAs, while daily MACD is trending lower below its signal line now. Meanwhile, Slow Stochastics continue to trend lower towards a move below its median line. The outlook is tentatively neutral, but below 72.25 would warrant an immediate downgrade to bearish; the measured move out of the consolidation would be towards 68.90.
FX TRADING RESOURCES
Whether you are a new or experienced trader, DailyFX has multiple resources available to help you: an indicator for monitoring trader sentiment; quarterly trading forecasts; analytical and educational webinars held daily; trading guides to help you improve trading performance, and even one for those who are new to FX trading.
OTHER TECHNICAL FORECASTS:
Australian Dollar Forecast: AUD/USD, GBP/AUD May Still Make Breakout Progress Despite U-turns
British Pound Forecast: Turning Short-Term Negative
Equities Forecast: Bears Begin to Emerge for the Dow, S&P 500, DAX, FTSE and Nikkei
US Dollar Forecast: Dollar’s Retreat Adds Considerable Weight to a Five-Month Reversal Pattern
--- Written by Christopher Vecchio, CFA, Senior Currency Strategist
To contact Christopher, email him at cvecchio@dailyfx.com
Follow him in the DailyFX Real Time News feed and Twitter at @CVecchioFX.


