


Equities Talking Points:
- US Dollar Bounces From 95.00, Global Stocks Attempt to Build Support.
- Bears Drag S&P 500 Below 200-Day Moving Average, Risk Aversion Dangerously Broad.
- Are you looking for longer-term analysis of Equity prices? Check out our Quarterly Forecasts as part of the DailyFX Trading Guides.
Bears Run Amok
It was a brutal week across global stock markets. The bearish setup in the DAX from last week’s forecast filled-in quickly as prices in the index pushed down to fresh 18-month lows, but the bullish setup investigated in the Nikkei faltered as the September bullish breakout reversed with aggression. US stocks were the focal point, however, as American markets moved from feast to famine after setting fresh all-time highs just a week ago; and then turning into an aggressive sell-off back down to some key areas of support.
As we move towards next week, a number of items remain of interest. The economic calendar picks up a bit, and we’ll also see Q3 earnings announcements pick up out of the United States. This morning saw a number of banks report, and next week brings names such as Netflix, Blackrock (both on Tuesday), Paypal (Thursday) and Proctor & Gamble (Friday). This comes at an opportune time as US stocks have either just went on sale or started a bearish turn that could further wipe out what’s left of the Q3 bullish breakout in equities.
S&P 500 Moves Down for A Trend-Line Test
This week’s sell-off in the S&P 500 broke through a number support levels, and this is on top of last week’s break of the Q3 bullish trend-line that had held the lows in the index for the entirety of last quarter. At this point, we’re getting a bit of slowdown in the selling as another trend-line has come into play, and this can be found by connecting the lows from November of 2016 up to the April 2018 swing-low. This current projects to around 2750 on the index.
For next week we’re keeping a neutral forecast for the S&P 500. While the sell-off over the past week-and-a-half has been pronounced, there is little evidence at this stage to suggest that it’s anything more than a correction. With that said, the pace of the declines were rather pronounced, and traders would likely want to wait for the establishment of support before looking to re-employ bullish strategies on the S&P 500. A big level for that theme appears to be around 2795. This was the swing-high from yesterday, set just ahead of another wave of bearish price action. If we trade back above that level, we could move-forward with the idea that bulls are gaining ground after this week’s pullback, and that could then re-open the door for topside strategies.
Technical Forecast for the S&P 500: Neutral
S&P 500 Weekly Price Chart
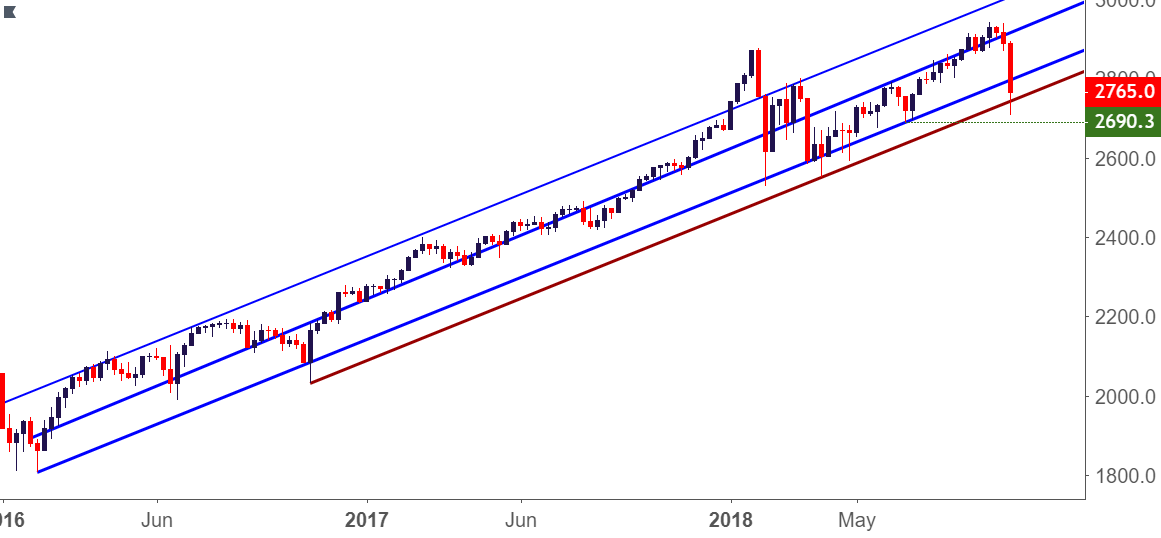
Chart prepared by James Stanley
Dow Digs Out Support Around 25k: But Can it Hold?
After setting a fresh all-time-high last Wednesday, the Dow has moved down to retrace 61.8% of last quarter’s bullish move. We had looked into the index on Wednesday as the selling was getting ramped-up, and we pointed out some deeper support levels that might help to stem the declines. The area around 25,000 appeared to assist with matters, and this showed-up again on Friday as it helped to mark the day’s low.
The 50% marker of the January sell-off is at 24,905, and this is confluent with a prior trend-line projection. This could keep open the door for bullish reversal plays in the Dow, but of the upmost importance will be stop management so that if this ten-day run of selling turns into something more, losses could be mitigated. The forecast on the Dow will be set to bullish for next week.
Technical Forecast for the Dow Jones Industrial Average: Bullish
Dow Jones Daily Price Chart

Chart prepared by James Stanley
DAX Breaks Down to Fresh 18-Month Low
Last week’s forecast looked into bearish strategies in the DAX, and this is filled in fairly quickly and selling remained prominent throughout the week. This eventually took out a big level of support around 11,727, as this is the March swing lows of the 2016-2018 major move in the index. The fear at this point is that the move may be a bit stretched, as seven consecutive days of selling finally ran into a bit of support on Friday with buyers holding the lows around 11,450. For next week, the forecast will remain as bearish.
Technical Forecast for the DAX: Bearish
DAX Weekly Price Chart: Fall to Fresh 18-Month Lows

Chart prepared by James Stanley
FTSE Tests 7K as Bulls Throw in the Towel
I don’t use the word 'plunge' often as it often feels to be hyperbolic in regards to market moves, but one look at the FTSE Daily chart and a trader would be challenged to qualify this week’s price action in any other way. In September, prices caught a support bounce at a key Fibonacci level and this pushed prices back-up to resistance around 7500. That even held into Q4, but from last Thursday-on, sellers have grabbed control and haven’t shown any signs of letting up until a small bounce began to develop on Friday.
The complication here is one of chart position: Intra-day lower-high resistance came-in off of the 78.6% Fibonacci retracement of the March-May major move, and this could even make the prospect of further downside look attractive as there’s evidence of lower-high resistance at a key level. But – that March low is very near, and this could cap profit potential, making the prospect of stops above the Friday swing rather unattractive from a risk management perspective. The forecast for next week on the FTSE will be set to neutral. This could flip to bearish upon a break of the March low at 6850.
Technical Forecast for the FTSE: Neutral
FTSE Daily Price Chart

Chart prepared by James Stanley
Nikkei Breakout Retraces
One of the more prominent moves from last month was a bullish breakout in the Nikkei as the index rushed up to fresh 27-year highs. This was in the equity forecast as the month-open was nearing, and in the first portion of the month that breakout filled-in in a very big way.
Last week, the technical forecast looked into bullish continuation strategies in the Nikkei, looking to catch higher-low support at an area of prior resistance. That level did not help to hold the lows, and prices have pulled back beyond the initial resistance from the ascending triangle formation. There has been a bit of support building around a bullish trend-line that can be found by connecting the March and August swing-lows, and prices have remained above the September swing-low; but at this stage, traders may want to wait for more confirmation of a return of strength before looking to trade the move-higher. For next week, the forecast on the Nikkei will be set to neutral. This could flip to bullish with a topside break of 23,000 but, until then, caution is the name of the game.
Technical Forecast for the Nikkei: Neutral
Nikkei Daily Price Chart: Breakout Retracement Tests Trend-Line Support

Chart prepared by James Stanley
To read more:
Are you looking for longer-term analysis on the U.S. Dollar? Our DailyFX Forecasts for Q1 have a section for each major currency, and we also offer a plethora of resources on USD-pairs such as EUR/USD, GBP/USD, USD/JPY, AUD/USD. Traders can also stay up with near-term positioning via our IG Client Sentiment Indicator.
Forex Trading Resources
DailyFX offers a plethora of tools, indicators and resources to help traders. For those looking for trading ideas, our IG Client Sentiment shows the positioning of retail traders with actual live trades and positions. Our trading guides bring our DailyFX Quarterly Forecasts and our Top Trading Opportunities; and our real-time news feed has intra-day interactions from the DailyFX team. And if you’re looking for real-time analysis, our DailyFX Webinars offer numerous sessions each week in which you can see how and why we’re looking at what we’re looking at.
If you’re looking for educational information, our New to FX guide is there to help new(er) traders while our Traits of Successful Traders research is built to help sharpen the skill set by focusing on risk and trade management.
--- Written by James Stanley, Strategist for DailyFX.com
Contact and follow James on Twitter: @JStanleyFX
Other Weekly Technical Forecast:
Australian Dollar Forecast: AUD/USD, GBP/AUD May Still Make Breakout Progress Despite U-turns
British Pound Forecast: Turning Short-Term Negative
US Dollar Forecast: Dollar's Retreat Adds Considerable Weight to a Five-Month Reversal Pattern


