


Talking Points – AUD/USD, GBP/AUD, RSI Divergence, Price Breakouts
- Australian Dollar experienced cautious gains against its major counterparts last
- AUD/USD and GBP/AUD see turnarounds, but progress was rather restrained
- Major technical barriers holding prevent a shift in their original technical views
Have a question about what’s in store for Australian Dollar next week? Join a Trading Q&A Webinar to ask it live!
AUD/USD Technical Outlook: Bearish
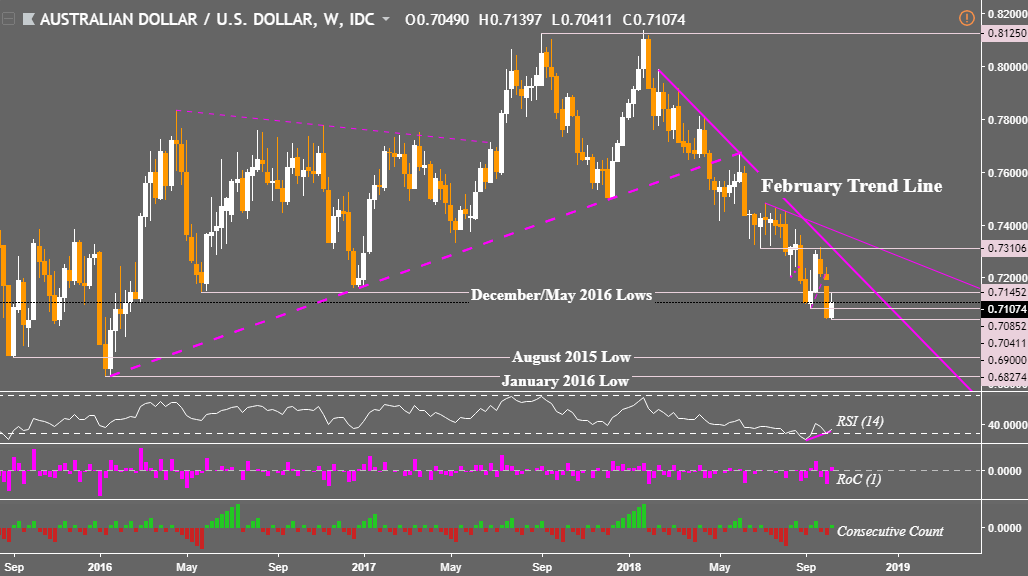
After achieving a breakout which resulted in a new 2018 low last week, the Australian Dollar struggled making further progress to the downside against its US counterpart. Looking at the weekly chart below, positive RSI divergence pointed out previously ended up being a precursor to a slight reversal. However, AUD/USD remains restrained by key near-term resistance levels that prevents a shift in the technical outlook for the week ahead.
AUD/USD Weekly Chart
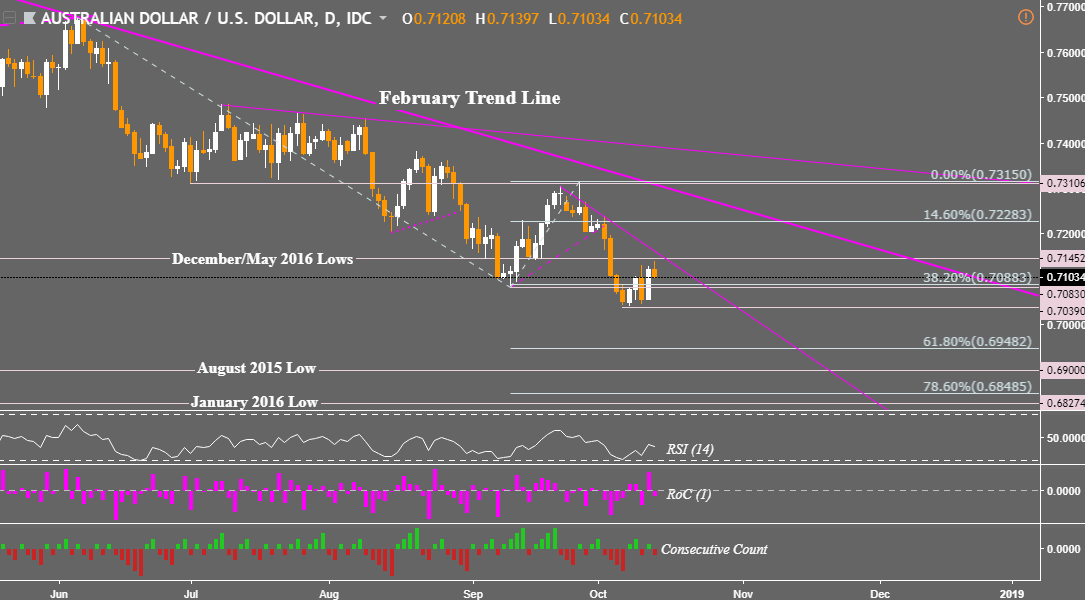
When taking a closer look at the AUD/USD daily chart, immediate resistance is a combination of two critical technical barriers. The first is the December/May 2016 lows around 0.71452. In the past, this area has acted as key support but has now established itself as new resistance. The second portion is a near-term descending trend line dating back to the latter half of September.
AUD/USD Daily Chart
We can get an even better look at these technical barrier by taking a look at the 4-hour AUD/USD chart. As always, confirmation of a bullish reversal will be needed via a close above 0.71452 and the aforementioned trend line. This exposes the 14.6% Fibonacci extension level at 0.72283 followed by 0.73106. But until Aussie Dollar pulls this off, the turnaround witnessed last week may only be a temporary.
Even if we get a bullish run in the Australian Dollar, it still needs to clear the February trend line to reverse the dominant downtrend since then. For now, the critical breakout seen last week should still be heeded. After a temporary correction, the Aussie may find itself resuming its dominant downtrend. In this case, near-term support is 0.70830 followed by 0.70390. A descent through the latter exposes the 2015 and 2016 low.
AUD/USD 4-Hour Chart

GBP/AUD Technical Outlook: Bullish
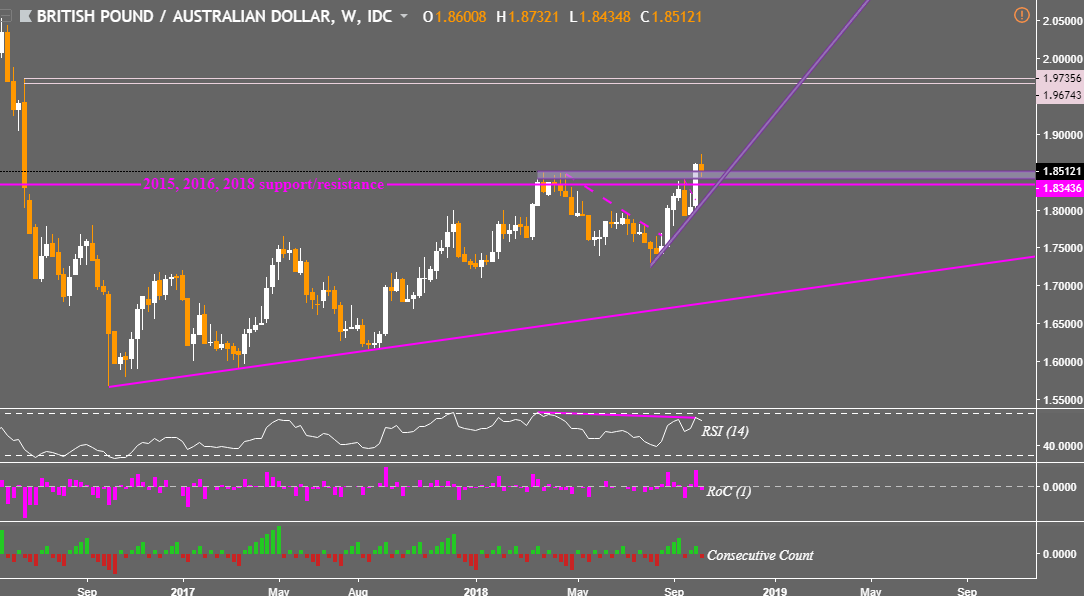
A similar behavior was witnessed in GBP/AUD this past week, although its direction is the exact opposite of AUD/USD. After achieving a breakout to the upside, the British Pound struggled making further progress against the Australian Dollar. Here too RSI divergence seemed to have been a warning sign of a pullback, and this one looks like it may also be only temporary.
GBP/AUD Weekly Chart
While GBP/AUD headed cautiously lower last week, the former resistance range between 1.85117 and 1.84193 held up nicely as new support when looking at the daily chart. Like with AUD/USD, key technical barriers holding up also prevent a shift in the outlook. Ideally, for a bearish reversal I would like to see a close under the rising range of support from August.
But getting there involves not only falling through 1.84193, but also clearing horizontal support/resistance at 1.83436 (this is made by connecting 2015, 2016 and 2018 points). Meanwhile resumption of the bullish signs from last week opens the door to eventually testing the 78.6% Fibonacci extension level at 1.88002. The technical outlook remains bullish.
For updates or questions about the Australian Dollar, you may follow and reach out to me on twitter here at @ddubrovskyFX.
GBP/AUD Daily Chart

** Charts created in TradingView
- Analyst Pick
FX Trading Resources
- Having trouble with your strategy? Here’s the #1 mistake that traders make
- See how the Australian Dollar is viewed by the trading community at the DailyFX Sentiment Page
- Just getting started? See our beginners’ guide for FX traders
--- Written by Daniel Dubrovsky, Junior Currency Analyst for DailyFX.com
To contact Daniel, use the comments section below or @ddubrovskyFX on Twitter


