


GBPUSD Technical Highlights, Prices and Analysis
- GBPUSD falls to a one-week low.
- Bullish higher high sequence broken.
We have recently released our Q3 Trading Forecasts for a wide range of Currencies and Commodities, including GBPUSD with our fundamental and medium-term term technical outlook.
Daily GBPUSD Chart Nears Moving Average Support
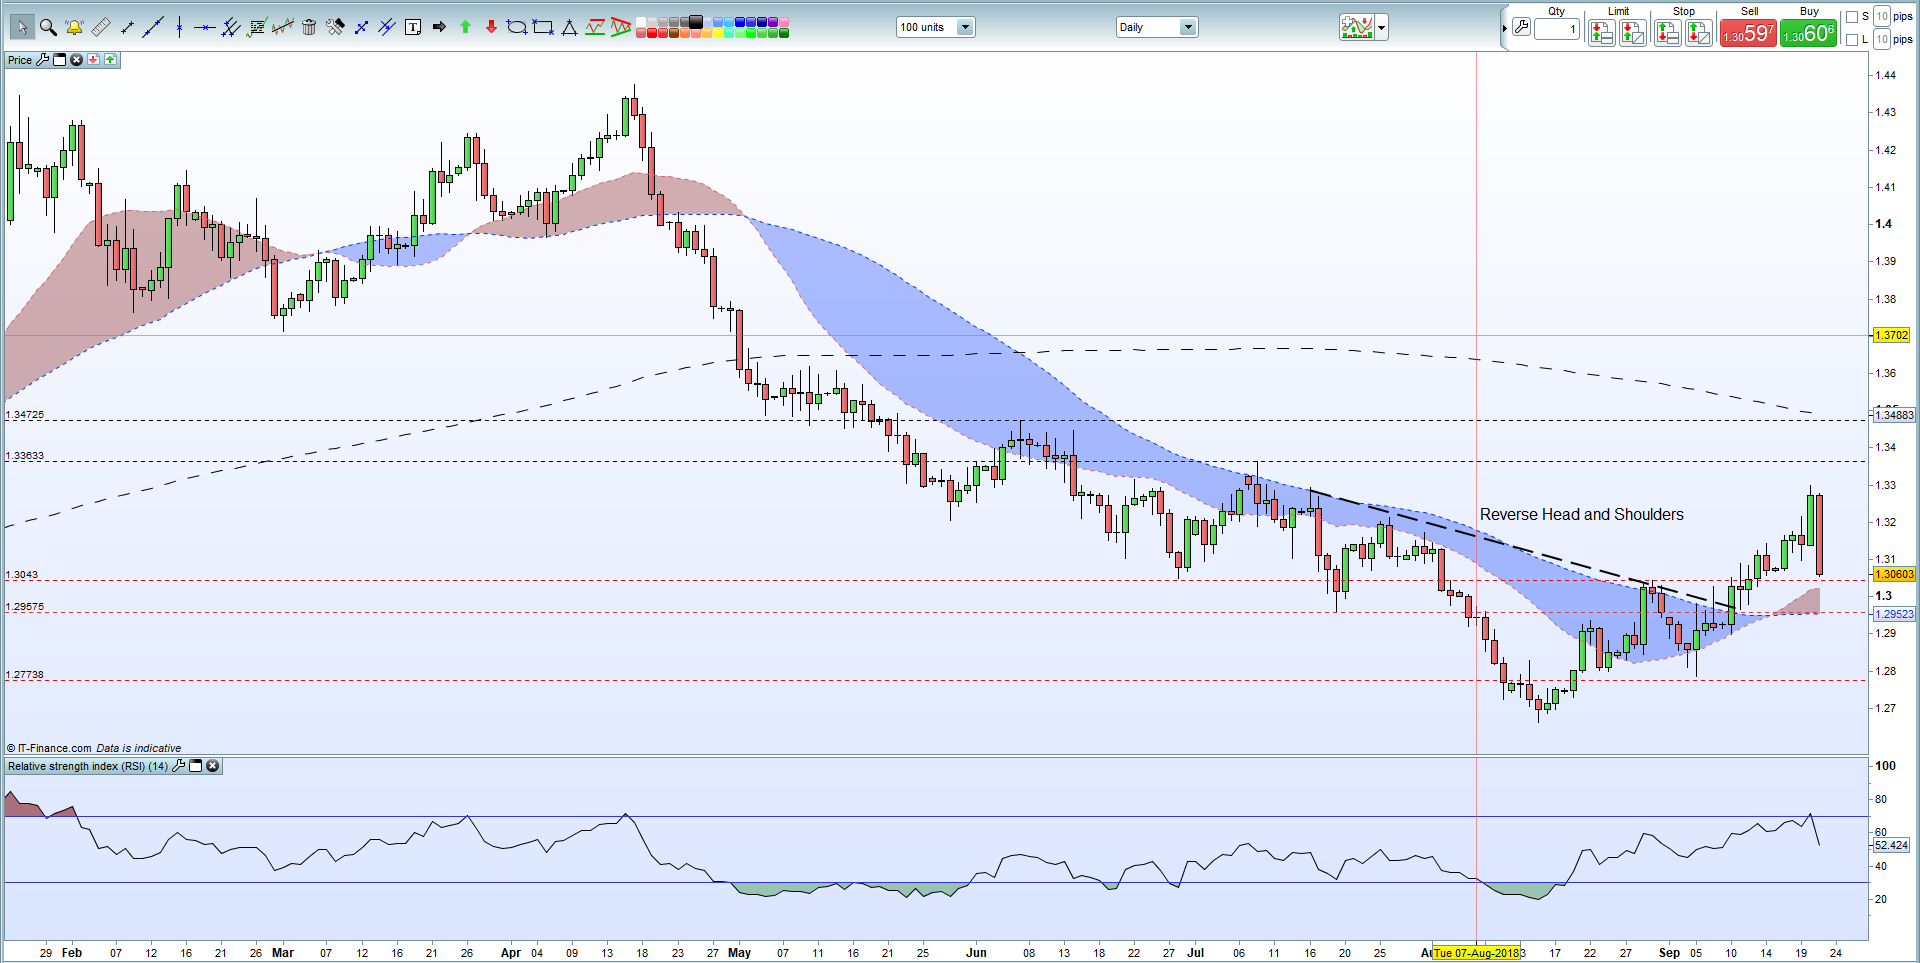
After a positive start to the week, helped by the move off the reverse head and shoulders pattern, Sterling dropped sharply Friday changing the technical landscape. The series of supportive higher highs have just been broken while today’s candle has just made a one-week low. The first levels of support now come from the 20- and 50-day moving averages at 1.30240 and 1.29527 respectively with the latter also in-line with the July 19 low print. The RSI indicator is pointing lower after falling out of overbought territory. Any upside movement is expected to be limited and capped below this week’s high around 1.3300.
GBPUSD Daily Price Chart (February - September 21, 2018)
The four hour chart shows the extent of the damage caused over the last 24 hours. The solid uptrend from the September 5 low just under 1.2800 has been broken decisively, while the 20-day moving average - which acted as a line of support - and the 50day ma have also been broken through. The August 30 high at 1.3040 may act as first support, ahead of psychological support at 1.3000 before a drop to the 200-day moving average, currently at 1.2925. On the upside the previously mentioned 20- and 50-day moving averages now act as resistance.
GBPUSD Four Hour Price Chart (August 12 – September 21, 2018)

GBPUSD Client Sentiment – Mixed Trading Bias
The IG Client Sentiment Indicator shows 54.8% of traders are net-long and coupled with recent positional changes we have a mixed trading bias on the pair.
DailyFX has a vast amount of resources to help traders make more informed decisions. These include a fully updated Economic Calendar, and a raft of constantly updated Educational and Trading Guides
--- Written by Nick Cawley, Analyst
To contact Nick, email him at nicholas.cawley@ig.com
Follow Nick on Twitter @nickcawley1
Other Weekly Technical Forecast:
Australian Dollar Forecast: AUD/USD Eyes Key February Trend Line as EUR/AUD Prolongs Reversal
Euro Forecast: Looking for Euro Breakout to Hold
US Dollar Forecast: Dollar Triggers a Technical Breakdown, Will Bears Show Up?
Equity Forecast: Risk-On Takes Hold of S&P 500, Dow, DAX, FTSE and Nikkei


