


Talking Points:
- EURUSD and DXY take out critical technical levels to further reversal patterns
- Momentum does not automatically follow breaks; so keep tabs on stragglers like AUDUSD, USDCAD
- Retail FX traders are net long Dollar vs the Euro but short vs Pound. See speculative positioning here.
Technical Forecast for US Dollar: Bearish
The bearish break Dollar traders have been keeping close tabs on for weeks was finally triggered this past week. Yet, just as with any journey, the destination isn’t reached with the first step. Unless we are trading derivatives, the break is only the start of an opportunity. Profit comes with the follow through that ensues. Is this a ‘loaded’ break that will find traction with motivated bearish interests or is it merely pressure relief for the speculative class that never musters the conviction of the wider market to establish meaningful trend. Technicals are not made for establishing motivation, but it can certainly lay out the levels that we can follow to tell us whether progress is being made or alternative intentions are being pursued.
For those monitoring the Dollar in general, one of the clearest signals – with one of the more convincing technical pictures – came from the ICE’s DXY Dollar Index. The benchmark cleared its 100-day simple moving average (SMA) and congestion that approximated the ‘neckline’ in a head-and-shoulders pattern that we have been keeping tabs on week in and week out. This is culmination for this traditional technical pattern, and the textbook assumption would be for natural follow through. Unfortunately, markets do not follow the established ‘rules’ so readily. While this index did clear the trendline forming the patterns support around 94.50/40, there is familiar congestion for this benchmark all the way down to 93.25 over the past four months. That is not to say it is a guarantee that it will hold, but if there isn’t conviction behind the bear’s efforts, they can use the moderate levels as an excuse to hold the line.

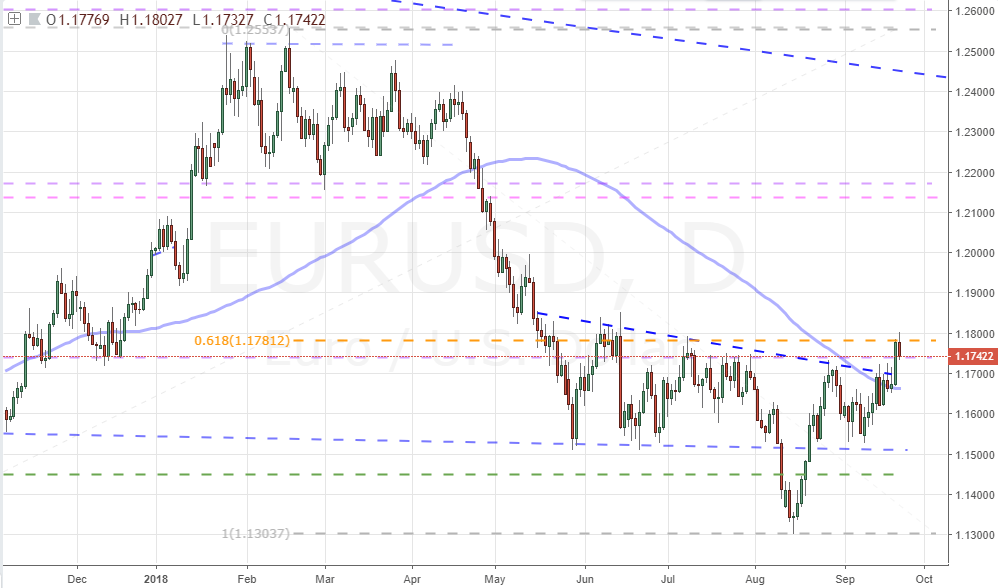
Amongst the ‘majors’ (the most liquid Dollar-based pairs), the EURUSD most clearly reflects the bearish ambitions for the Greenback. The pair’s technical picture the mirror of DXY with 1.1700 standing as its ‘neckline’ in an inverse head-and-shoulders pattern. There is also a 38.2% Fibonacci retracement of the April to August bear trend landing around 1.1740 which could be used as further evidence of an important break. However, if we extend the evaluation of that range out to the February high, the same retracement level actually falls around 1.1785 and still stands through the end of the week. To clear the entire congestion phase back to May, we would need to move beyond 1.1845 and the 200-day SMA stands at 1.1950. Those are levels to keep tabs on for follow through. If, on the other hand, the market drops back below 1.1700; the sense of a false break reversal will start to set in. And, given the girth of just such a failure back in August below 1.1500, traders would readily take to the range implications.
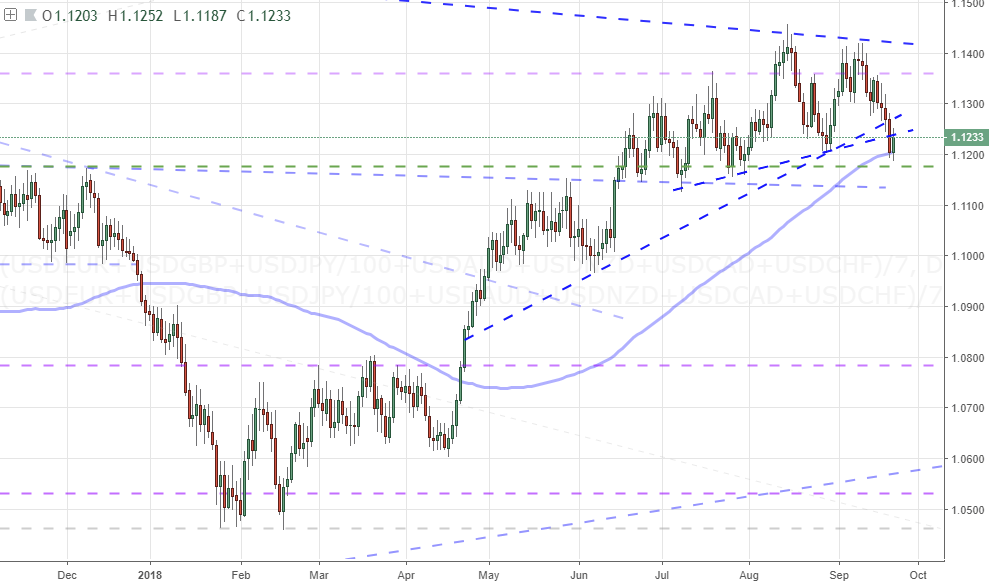
Not all Dollar signals are as clear as the DXY or EURUSD however. Taking a look to an equally-weighted measure derived from all of the majors, we find there is far denser congestion from these past three months to deal with and much less progress. The particular chart-based technical signals here carry far less weight as they will not elicit any response from traders – few actually pull up this composite. However, measures of activity such as the Average True Range (ATR), momentum gauges and relative strength figures offer reasonable approximation for the currency-at-large. And from these, there is still a reserved signal for intent. It would pay therefore to keep targets to reasonable distance and look for further breaks from the pace-setters or further reinforcement from other Dollar pairs before we throw in our deep conviction.
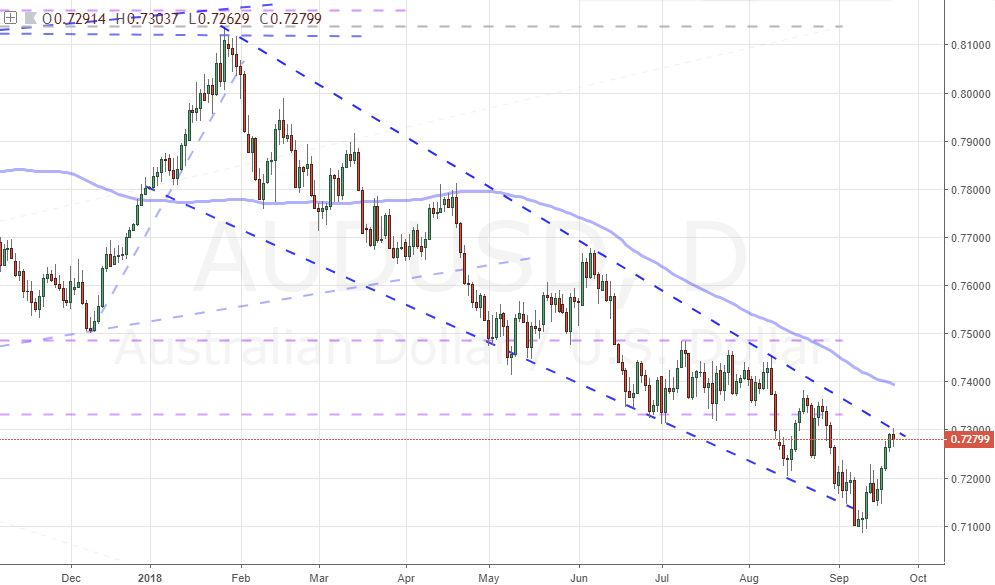
Looking across the Dollar pairs, there are a few examples of majors that have yet to signal the shot from the speculative starting gun. For example, the AUDUSD below has moved up to the border of its 2018 descending trend channel at 0.7300, but the critical break has yet to be registered. If the Dollar will genuinely be toppled, expect this resistance to clear next week. Similarly, USDCAD will break below 1.2900 range support (and 200-day SMA at 1.2864); and GBPUSD will compete with Brexit to move back towards 1.3300. Perhaps one of the more curious cases of Dollar weakness is the USDJPY’s advance towards a 19 month trendline now at 113 which could present a range trade rather than a breakout-style drive.
Other Weekly Technical Forecast:
Australian Dollar Forecast: AUD/USD Eyes Key February Trend Line as EUR/AUD Prolongs Reversal


