


Technical Forecast for US Dollar: Bearish
Talking Points:
- On the heels of the failed inverse head-and-shoulders break in August, the 95 neckline break stalled
- Liquidity likely played a crucial role in preventing progress, but September historically brings volume
- Retail FX traders are net short Dollar versus the Euro and Pound. See speculative positioning here.
Those trading the Dollar recently have likely been frustrated by the lack of projection from what are otherwise convincing technical breaks from the benchmark currency. On August 10th, the DXY Dollar Index earned a charged bullish break above 96 which cleared both the midpoint of the 2001-2008 range still in place and the ‘neckline’ on an inverse head-and-shoulders (H&S) pattern that had formed over the preceding 13 months. Despite the serious credibility this setup would otherwise carry, the market’s climb quickly stalled and fell back into range with the resonance of a false breakout carrying over. Just a few weeks later, the market attempted to charge a similar move in the opposite direction with the same ultimate outcome. August’s failed bullish breakout left us with an ‘upright’ H&S with a neckline at 95. That floor was cleared this past week and the move took out a trendline support from early may in the process. Yet, once again, conviction vanished before any real progress was made.
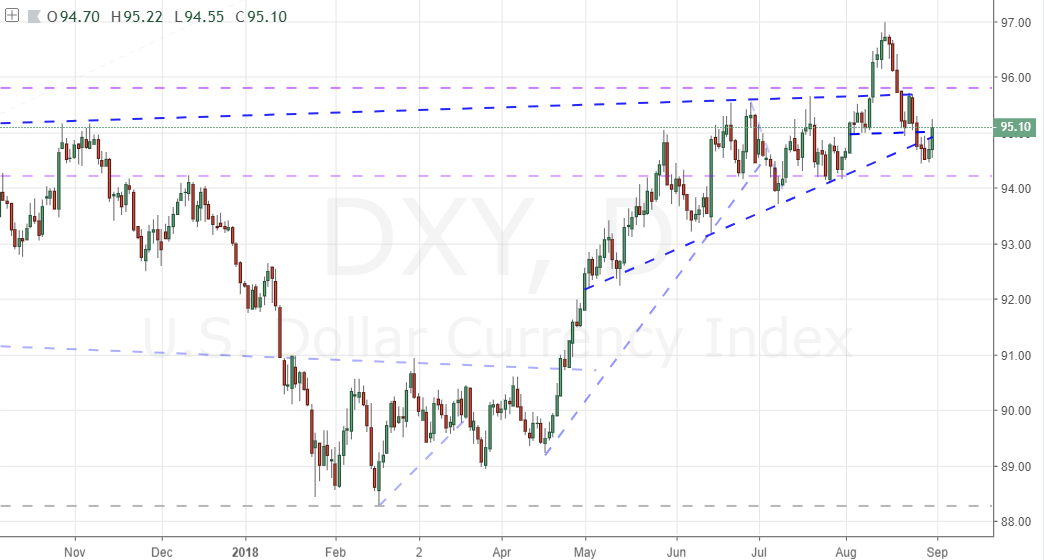
Following back-to-back failed efforts by the market to transition from congestion to productive trend, there is a reasonable adaptation that may be made by the astute market participant. Burned twice, there will be a deeper reticence by traders to jump on any subsequent moves by the Dollar that seem to promise the opportunity of a breakout with substantive follow through. However, we should not be so skeptical moving forward. There is a systemic change underlying the market. With this past week, we have closed out August and the so-called ‘Summer Lull’ – a period historically that sees volume and volatility drained across the financial system with a default market characteristic where trends are more difficult to maintain and even more arduous to start. In contrast, the month of September historically represents a return of liquidity and the restoration of momentum (when properly motivated of course).
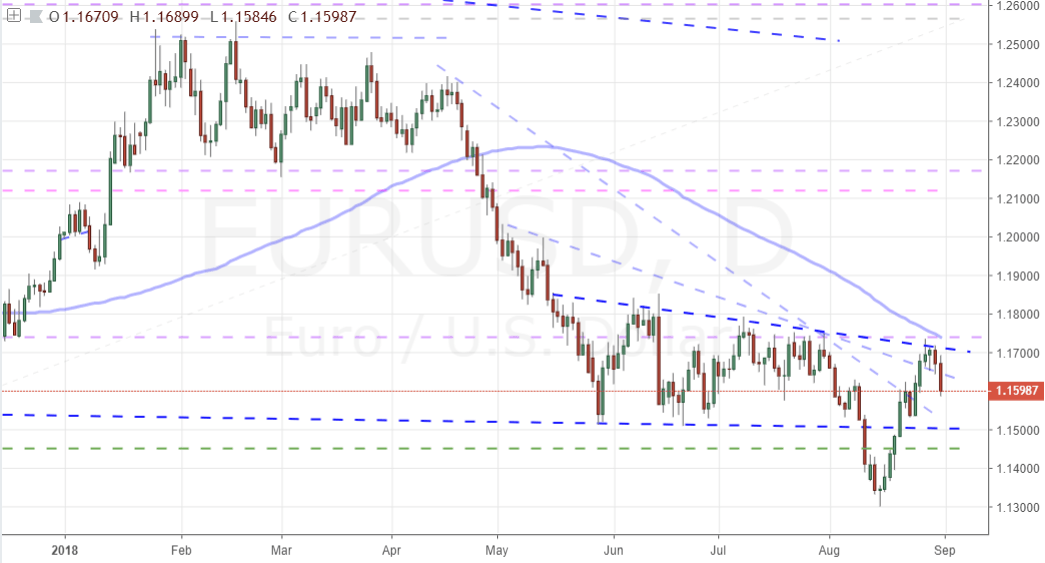
Considering the DXY has defused two key technical patterns in both directions this past month, the currency will need to cover more ground before we can return to levels that would be more widely considered a critical break. To fuel the bull trend, the Index overtaking its August high at 97 and/or EURUSD sliding below 1.1300 would go a long way to rousing serious bullish interest. Meanwhile, with pairs like GBPUSD, AUDUSD and USDJPY already pushing medium-term bullish favorable runs; it may prove difficult to build up the drive necessary from the broader FX market to secure systemic momentum for the currency. Alternatively, the general advance from the currency since April can set the stage for a more decisive bearish run. DXY 94.40 may still follow a progression pattern through the preceding 95 neckline break of August’s H&S. Amongst the majors, that would have good proxy with EURUSD above 1.1725, GBPUSD above 1.3050 and USDCAD below 1.2900.
Considering we are closing out the month – and likely in the midst of an environment shift – it is worth taking a look at the higher time frame Dollar charts as well. Below is the monthly chart of the DXY futures contract. Immediately apparent is the lack of progress of the previous three months and the hold at the mid-point to the 2001 to 2008 range at 96. It is also worth noting that on this time frame, the intra-month reversal left us with the biggest ‘upper wick’ since July 2011. That is not a high probability reversal signal unto itself, but it can add weight to other factors. Volume is one such alternative consideration. Turnover from this derivative (we have not spot volume on FX aside from the BIS’s one-ever-three-years report) has clearly deflated. A prompt to activity is a cue for volatility. And, given the increase in correlation between this benchmark and other risk assets like the S&P 500 lately, that can tip a move towards a bearish slide back towards lows set earlier in the year.

Other Weekly Technical Forecasts:
Australian Dollar Forecast: AUD/USD Downtrend Resumes, Eyes Mid-2016 Lows as Momentum Fades
Euro Forecast: Euro Holds Monthly Support But Deeper Losses Likely Ahead


