


Australian DollarTechnical Forecast:Bearish
AUD/USD Prices Talking Points – Positive RSI Divergence, Fibonacci Levels, 2018 Downtrend
- AUD/USD prices resumed their descent on the daily chart, eyeing mid-2016 lows
- Near-term support between 0.7160 and 0.7145, resistance at 0.72699 and 0.7381
- Positive RSI divergence indicatesdecreasingAUD/USD downside momentum
- Just getting started trading? See our beginners’ guide for FX traders to learn how you can apply this in your strategy!
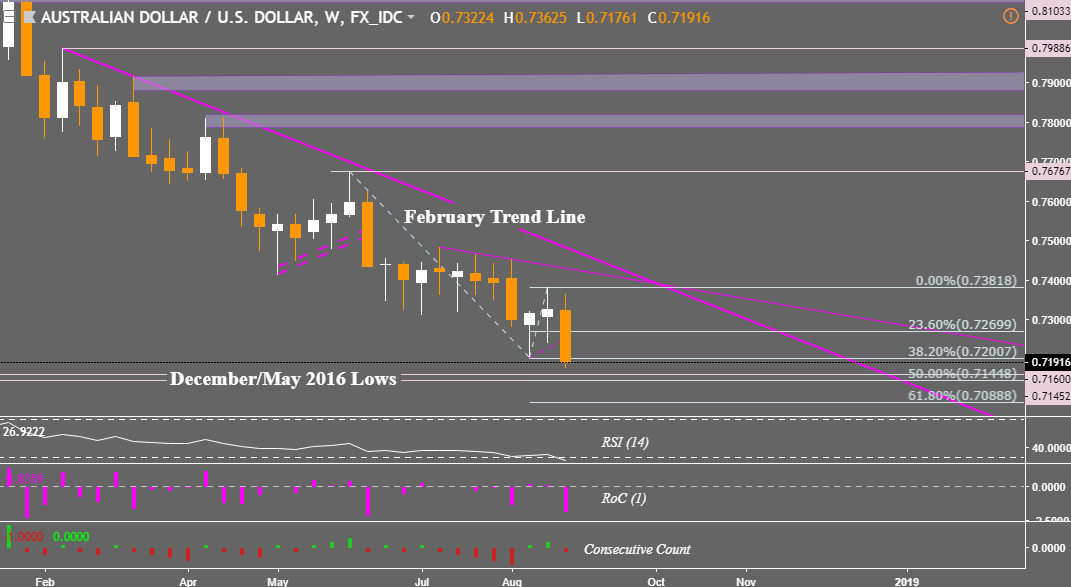
The Australian Dollar resumed its descent against its US counterpart, clocking in its largest decline in a week since the middle of June which was over two months ago. This prolonged AUD/USD’s 2018 dominant downtrend and effectively cancelled out a bullish reversal pattern that once threatened to push the pair to the descending trend line from February. We may see more declines in the week ahead.
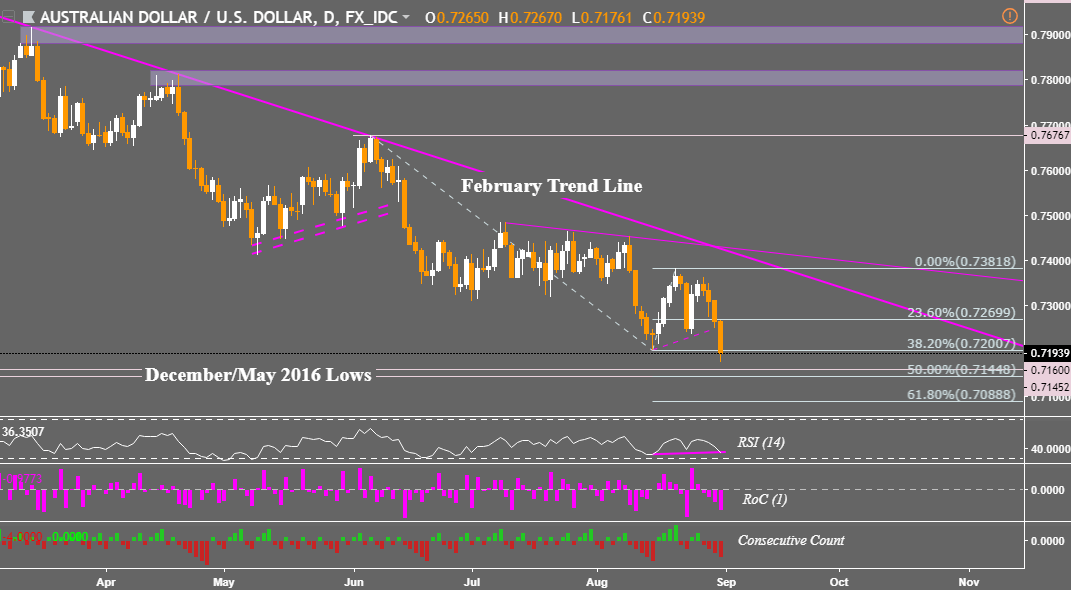
If we look at prices on the AUD/USD daily chart, we can see that it went on a daily losing streak of 4 which was its longest in over two weeks. We also had the pair fall under a near-term rising line and close at its lowest point this year thus far. The descent through the August 15th low around 0.7200 now exposes the December and May 2016 lows between 0.7160 and 0.7145.
Falling beyond that could have AUD/USD eyeing the 61.8% Fibonacci extension at 0.7088 as it heads for 2016 lows. Meanwhile, immediate resistance appears to be the 23.6% extension at 0.7269. A climb beyond that exposes the August 21st high at 0.7381 which would put the Australian Dollar back into the range it consolidated in for a couple of months.
While the new 2018 low opens the door for the pair to resume its dominant downtrend, do note that downside momentum is ebbing on the daily chart. This is represented by positive RSI divergence and this warns that prices could turn higher next or consolidate. While this does not guarantee a reversal, it should warrant caution especially if the pair find itself struggling to descend through the December and May 2016 lows.
The AUD/USD technical outlook will change to bearish from neutral for the week ahead.
** Charts created in TradingView
We just released our 3Q forecasts for equities and the US Dollar in the DailyFX Trading Guides page
FX Trading Resources:
- Having trouble with your strategy? Here’s the #1 mistake that traders make
- See how the Australian Dollar is viewed by the trading community at the DailyFX Sentiment Page
- Have a question about the Australian Dollar technical outlook? Join a free Q&A webinar and have your trading questions answered
--- Written by Daniel Dubrovsky, Junior Currency Analyst for DailyFX.com
To contact Daniel, use the comments section below or @ddubrovskyFX on Twitter


