


Australian Dollar Technical Forecast: Bullish
AUD/USD Talking Points – Hammer Formation, Morning Star Pattern
- AUD/USD prices remain in this year’s dominant downtrend, hinting bigger picture is bearish
- Near-term, hammer and morning star bullish reversal patterns warn prices may turn higher
- Immediate resistance is a mix of two 2018 descending trend lines, support above 2016 lows
Just getting started trading? See our beginners’ guide for FX traders to learn how you can apply this in your strategy!
On a weekly chart, the previous candle in AUD/USD marked a break below persistent consolidation which lasted for almost two months. In fact, it was the largest decline in a week since early June. However, the most recent candle presents a warning sign that prices may push higher ahead. A hammer, which is a bullish formation pattern, formed. It also marked the conclusion of AUD/USD’s longest consecutive losing streak since May 2016 (albeit the progress lower was small due to consolidation).

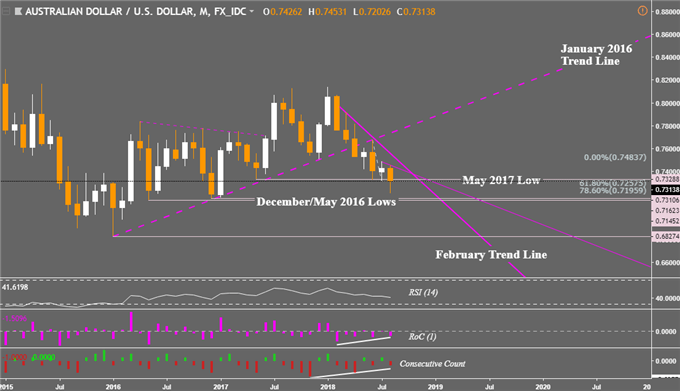
If we turn our attention to the monthly chart however, we can see that the downtrend in AUD/USD since February remains intact. But here there are also warning signs that the pair may push higher or keep on consolidating.
We do have some positive rate of change (RoC) and consecutive count divergence. The former means each monthly progress lower has been coming in at smaller bursts. The latter shows that the streaks to the downside have been coming in at decreasing lengths. These are signs that downside momentum could be ebbing.
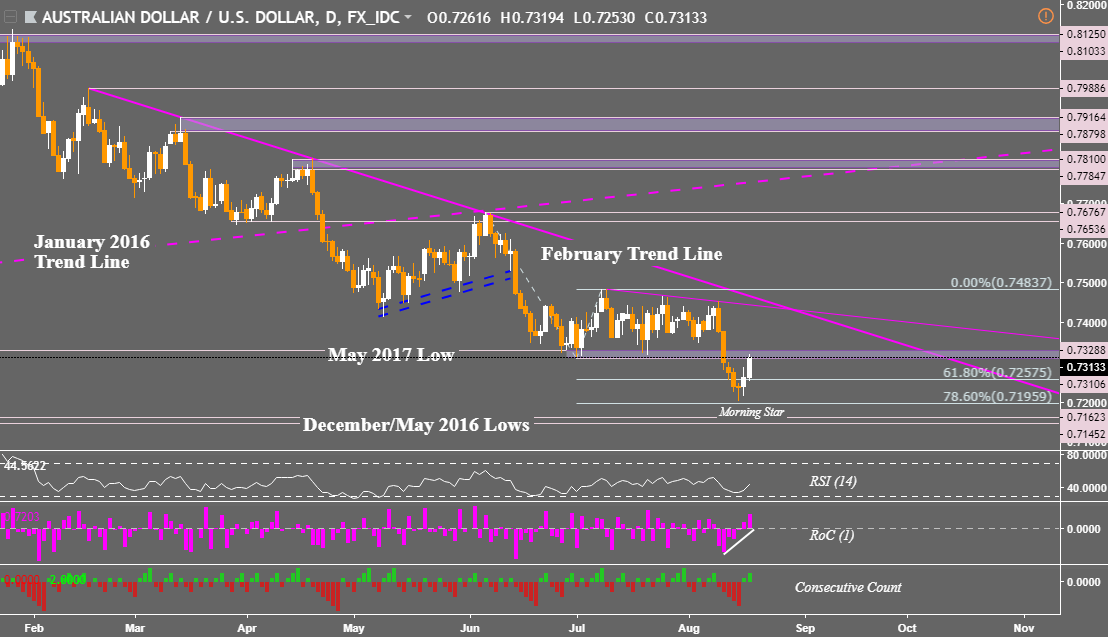
So in the event AUD/USD pushes higher, where can we anticipate prices to go next? Let us take a look at the daily chart to find out. For starters, we also have a bullish reversal candlestick formation here. This one is a morning star. The presence of positive RoC divergence also preceded the pair’s recent push higher to within consolidation range support between 0.73106 and 0.73288.
Given that Friday’s close offered confirmation of the morning star pattern, we may see AUD/USD climb next to a couple of near-term descending resistance lines that are intersecting. One of them is the February trend line and the other is a combination of three recent highs within the pair’s consolidation over the past couple of months. A push higher then exposes a range of resistance between 0.76536 and 0.76767.
Do note that as of Friday’s close, the pair was caught by support of (June – August) consolidation which appears to be acting as new resistance. Since it was not able to get above it, it could hold and keep AUD/USD from rising any further. Such an outcome opens the door for the pair to continue oscillating back and forth around it or perhaps even turn lower.
In the event AUD/USD prices do turn lower, we could see the pair retest the new 2018 low around 0.71959 which coincidentally is also closely aligned with the 78.6% Fibonacci extension. A break under that then exposes the December/May 2016 lows between 0.71623 and 0.71452. Fundamentally speaking, the latter seems more likely in the bigger picture and could open the door for an attractive selling opportunity.
We just released our 3Q forecasts for equities and the US Dollar in the DailyFX Trading Guides page
FX Trading Resources:
- Having trouble with your strategy? Here’s the #1 mistake that traders make
- See how the Australian Dollar is viewed by the trading community at the DailyFX Sentiment Page
- Have a question about the Australian Dollar technical outlook? Join a free Q&A webinar and have your trading questions answered
--- Written by Daniel Dubrovsky, Junior Currency Analyst for DailyFX.com
To contact Daniel, use the comments section below or @ddubrovskyFX on Twitter
** Charts created in TradingView


