


- DXY rally facing exhaustion below 200WMA- interim support 94
- Check out our 2018 USD projections in our Free DailyFX Trading Forecasts
- Join Michael for Live Weekly Strategy Webinars on Mondays at 12:30GMT
In this series we scale-back and take a look at the broader technical picture to gain a bit more perspective on where we are in trend. Here are the key levels that matter on the weekly chart for the US Dollar Index (DXY). Review this week’s Strategy Webinar for an in-depth breakdown of this setup and more.
New to Forex Trading? Get started with this Free Beginners Guide
USD Weekly Price Chart (DXY)
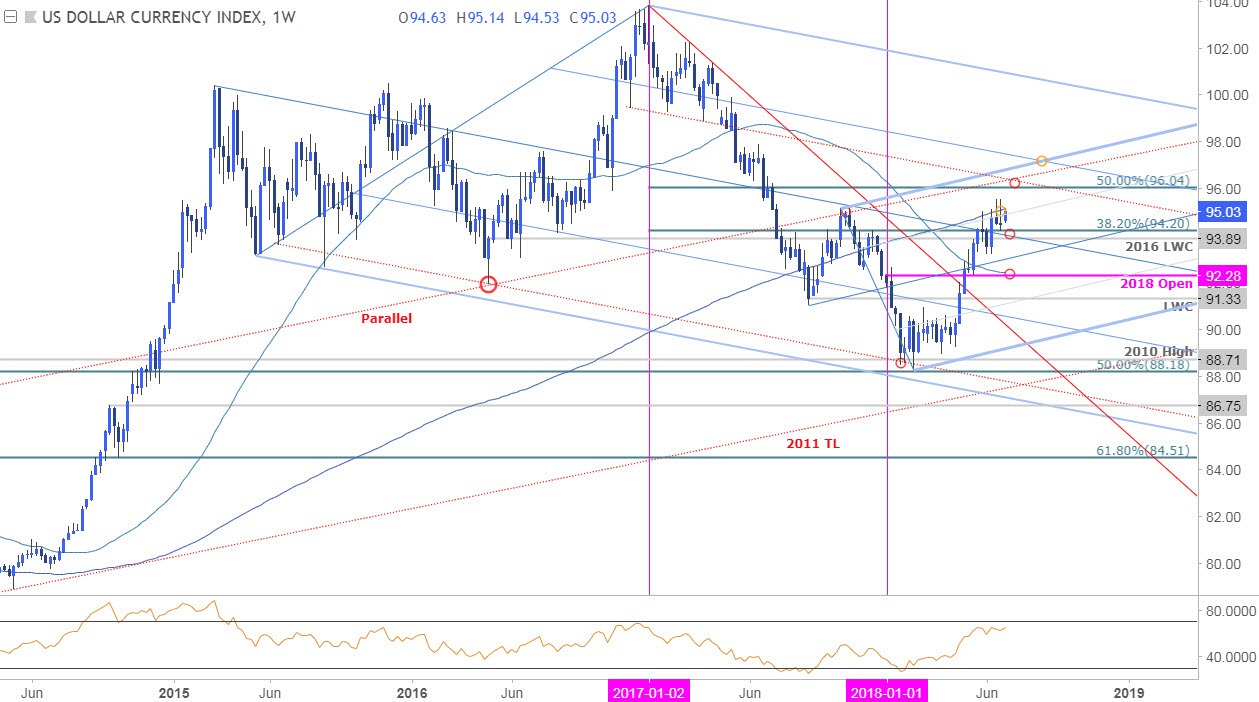
Notes: In last month’s US Dollar Weekly Technical Perspective, we highlighted topside resistance targets at the 200-day moving average, now around ~95.10. The index has been unable to close above this threshold with price failing the last four weekly attempts. The focus is on this key region heading into the start of the week/month/quarter, with the dollar rally at risk while below.
Interim support rests at 93.89-94.20 where the median-line of the broader descending pitchfork formation converges on the 38.2% retracement and the 2016 low-week reversal-close. A break there would shift the focus towards the median-line of ascending formation around ~93 with key support at the confluence of the 52-week moving average and the yearly open at 92.28. Topside resistance targets are unchanged in the event of a breach with such a scenario targeting 50% retracement at 96.04 backed by the slope confluence just higher around 97.10.
For a complete breakdown of Michael’s trading strategy, review his Foundations of Technical Analysis series on Building a Trading Strategy
Bottom line: Look for dollar price exhaustion on another attempt at the highs with a break below 93.89 needed to validate a larger correction. Watch the weekly momentum profile as RSI targets highs not seen since the 2016/2017 peak in price.
Even the most seasoned traders need a reminder every now and then- Avoid these Mistakes in your trading
Relevant USD Data Releases

Economic Calendar – for the latest economic developments and upcoming event risk
Previous Weekly Technical Perspectives
- Weekly Technical Perspective on the Japanese Yen (USD/JPY)
- Weekly Technical Perspective on the Euro (EUR/USD)
- Weekly Technical Perspective on the British Pound (GBP/USD)
- Weekly Technical Perspective on the New Zealand Dollar (NZD/USD)
- Weekly Technical Perspective on the Canadian Dollar (USD/CAD)
--- Written by Michael Boutros, Technical Currency Strategist with DailyFX
Follow Michael on Twitter @MBForex or contact him at mboutros@dailyfx.com


