


- USD/JPY in consolidation just below resistance- March rally at risk sub-111.65
- Check out our 2018 USD/JPY projections in our Free DailyFX Trading Forecasts
- Join Michael for Live Weekly Strategy Webinars on Mondays at 12:30GMT
In this series we scale-back and take a look at the broader technical picture to gain a bit more perspective on where we are in trend. Here are the key levels that matter on the weekly chart for the US Dollar vs the Japanese Yen (USD/JPY). Review this week’s Strategy Webinar for an in-depth breakdown of this setup and more.
New to Forex Trading? Get started with this Free Beginners Guide
USD/JPY Weekly Price Chart
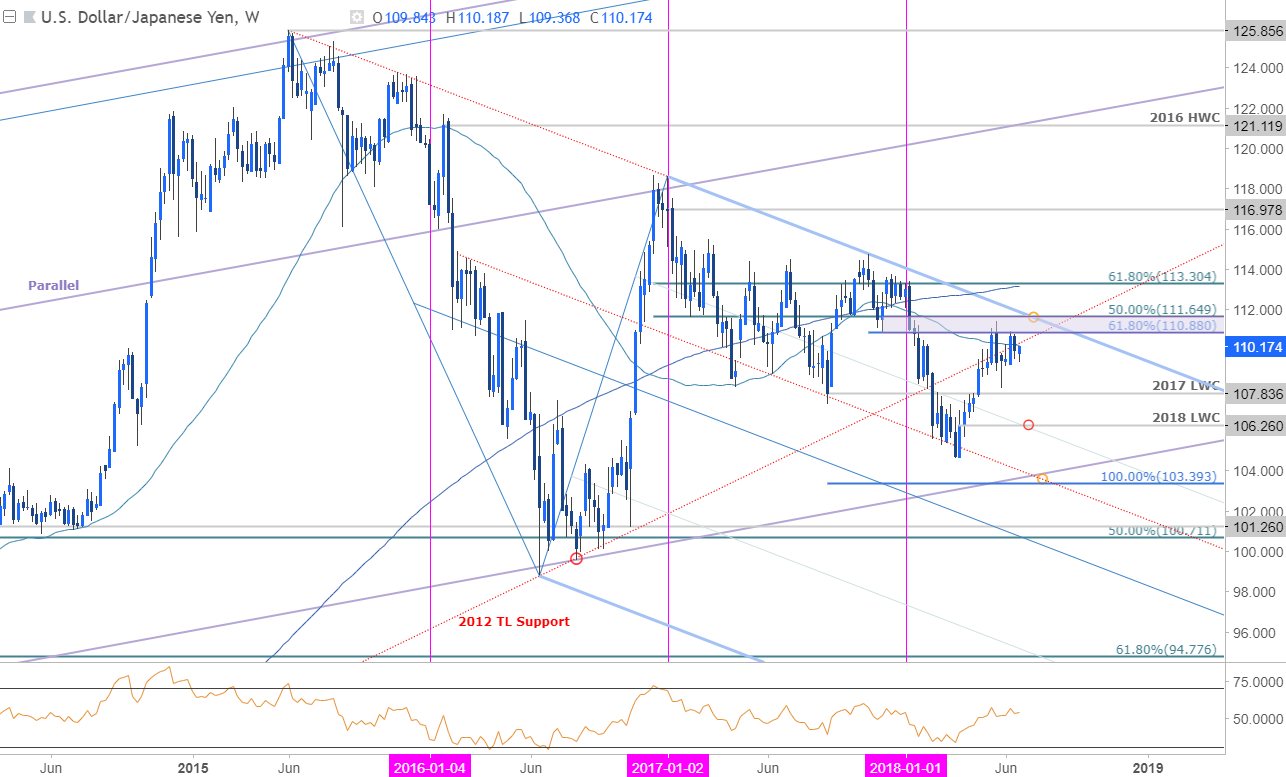
Notes: USD/JPY has continued to consolidate just below a key resistance range at 110.88-111.65- a region defined by the 61.8% retracement of the November sell-off and the 50% of the broader decline off the late-2016 high. In my previous USD/JPY Technical Perspective we highlighted that, “slope resistance extending off the 2015 highs converges on this resistance zone over the next few weeks and may limit further advances in the medium-term. The momentum profile also suggests the advance may be vulnerable here with weekly RSI holding below the 60-threshold (sub-60 since early 2017).” These conditions remain relevant heading into the close of June trade.
Our downside support targets are unchanged with initial weekly support, “at 107.84 backed by the yearly low-week close at 106.26. A topside breach / close above this resistance range would be needed to mark resumption with such a scenario targeting the 200-week moving average / 61.8% retracement at 113.00/30.”
For a complete breakdown of Michael’s trading strategy, review his Foundations of Technical Analysis series on Building a Trading Strategy
Bottom line: Look for a break of this consolidation zone in the days ahead with the broader March rally still at risk while below 111.65. From a trading standpoint, look for a weekly close below the 52-week / 200-day moving averages at 110.20/30 to keep the pressure on. The intraday USD/JPY levels are largely unchanged from earlier this month, but we’ll publish an update later this week- still looking for further clarity in near-term price action.
Even the most seasoned traders need a reminder every now and then- Avoid these Mistakes in your trading
USD/JPY IG Client Positioning
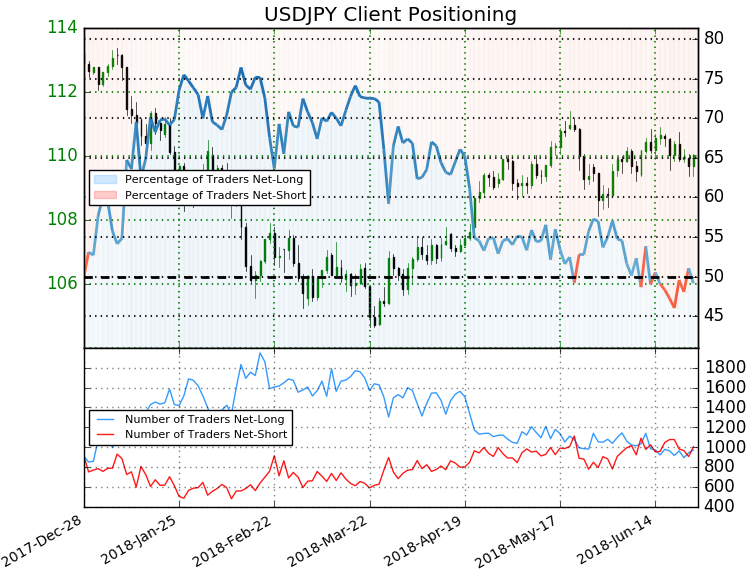
- A summary of IG Client Sentiment shows traders are net-short USD/JPY- the ratio stands at -1.03 (49.1% of traders are long) – extremely weak bullishreading
- Long positions are 2.0% lower than yesterday and 4.4% higher from last week
- Short positions are2.4% lower than yesterday and 4.0% lower from last week
- We typically take a contrarian view to crowd sentiment, and the fact traders are net-short suggests USD/JPY prices may continue to rise. Yet traders are less net-short than yesterday and compared with last week. Recent changes in sentiment warn that the current USD/JPY price trend may soon reverse lower despite the fact traders remain net-short.
See how shifts in USD/JPY retail positioning are impacting trend- Learn more about sentiment!
Relevant USD/JPY Data Releases
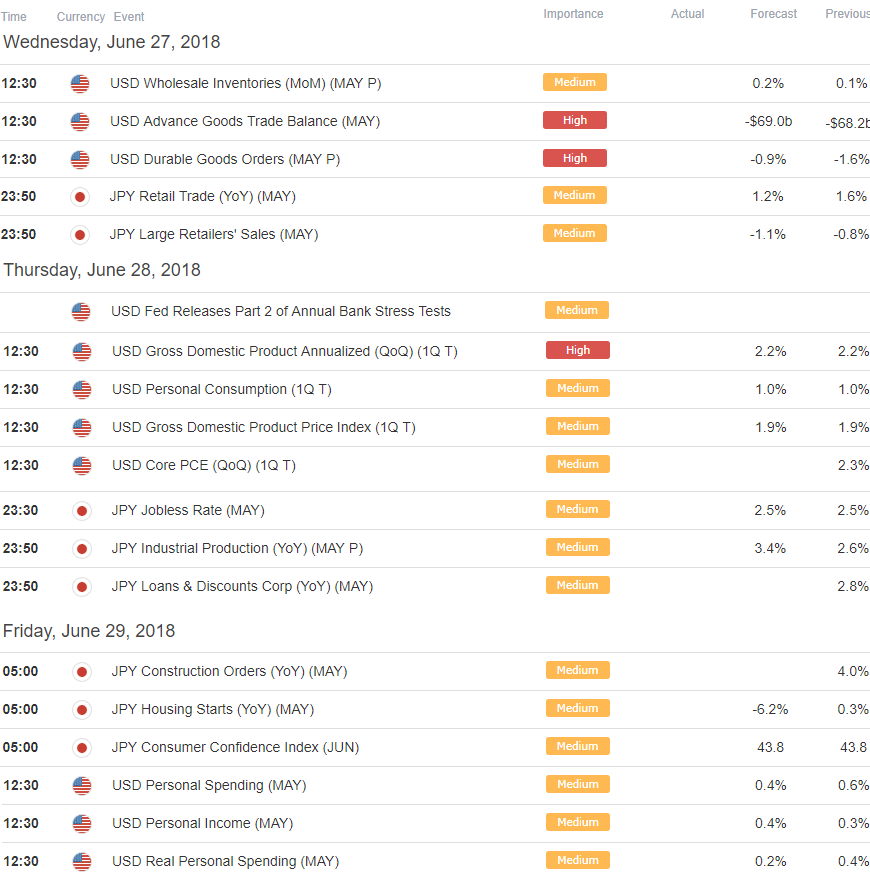
Economic Calendar – for the latest economic developments and upcoming event risk
Previous Weekly Technical Perspectives
- Weekly Technical Perspective on the Euro (EUR/USD)
- Weekly Technical Perspective on the British Pound (GBP/USD)
- Weekly Technical Perspective on the New Zealand Dollar (NZD/USD)
- Weekly Technical Perspective on the Canadian Dollar (USD/CAD)
- Weekly Technical Perspective on the US Dollar (DXY)
--- Written by Michael Boutros, Technical Currency Strategist with DailyFX
Follow Michael on Twitter @MBForex or contact him at mboutros@dailyfx.com


