


- A look at the weekly technicals as the US Dollar Index (DXY) presses yearly highs
- Check out our 2018 USD projections in our Free DailyFX Trading Forecasts
- Join Michael for Live Weekly Strategy Webinars on Mondays at 12:30GMT
In this series we scale-back and take a look at the broader technical picture to gain a bit more perspective on where we are in trend. The USD is testing near-term resistance here but the broader risk remains weighted to the topside. Here are the key levels that matter on the weekly chart for the US Dollar (DX) heading into the close of the month. Review Today's Strategy Webinar for an in-depth breakdown of this setup and more.
New to Forex Trading? Get started with this Free Beginners Guide
USD Weekly Price Chart (DXY)
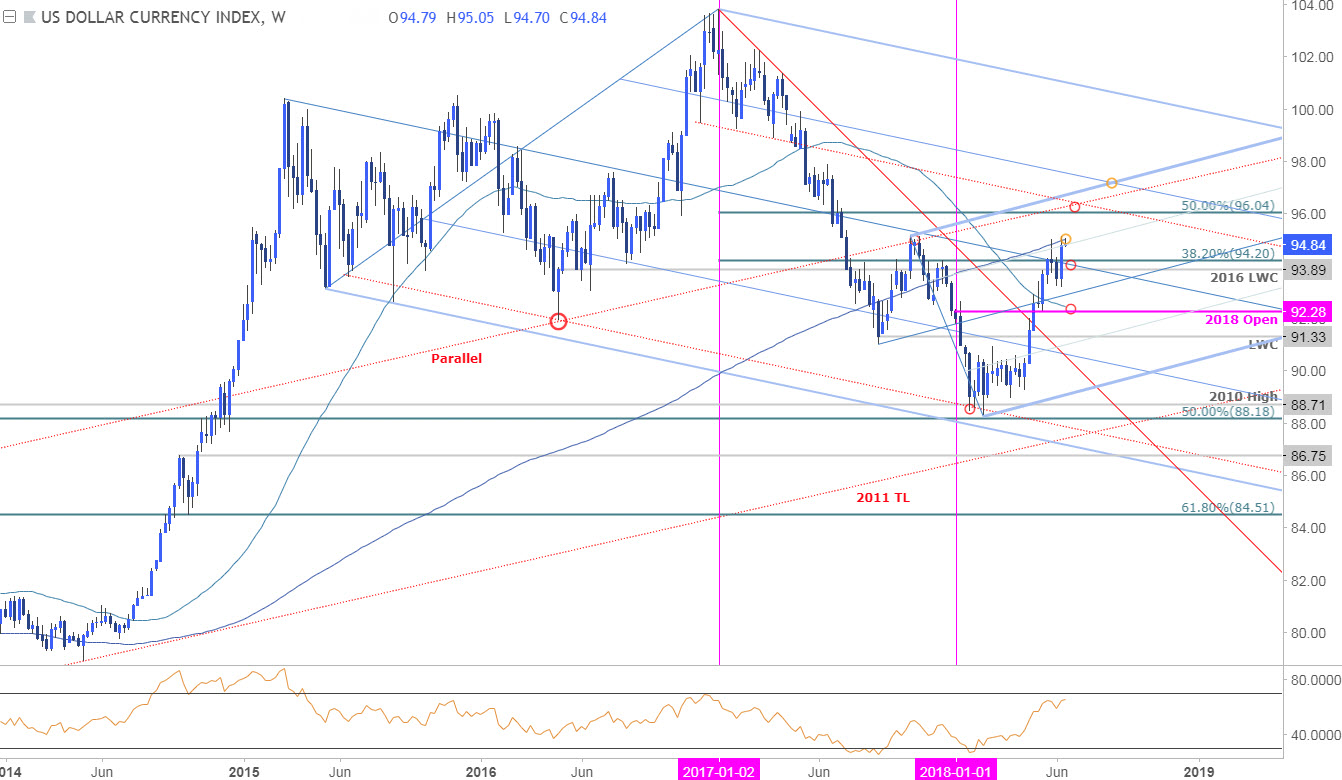
Notes: In last month’s US Dollar Weekly Technical Perspective, we noted that the USD was, “testing confluence resistance at 93.89-94.20 where the 2016 low-week reversal close and the 38.2% retracement of the 2017 decline converge on the median-line… A breach above this key zone targets subsequent resistance targets at the 200-week moving average at 94.80 and the 50% retracement at 96.04.”
Last Week’s FOMC policy meeting saw interest rate expectations shift as markets priced in a fourth rate hike this year- near-term bullish for the USD. The Dollar Index posted an outside weekly reversal through confluence resistance with the rally stretching into the 200-week moving average, now at ~95. A newly identified ascending pitchfork formation extending off the 2017 and 2018 lows also has price testing the upper 50-line into the start of the week.
For a complete breakdown of Michael’s trading strategy, review his Foundations of Technical Analysis series on Building a Trading Strategy
Bottom line: The Dollar is testing near-term resistance here and while we could see some pullback in price, the broader focus is on a hold above the 93.89-94.20 pivot zone. A breach higher from here targets 96.04/35 backed by the median-line confluence just above the 97-handle.
A break below last week’s low targets the median-line of the newly added formation around ~92.90s with critical support / bullish invalidation steady at the yearly open / 52-week moving average at 92.28/45. From a trading standpoint, I’ll favor fading weakness while above 93.90.
Even the most seasoned traders need a reminder every now and then- Avoid these Mistakes in your trading
RELEVANT USD DATA RELEASES
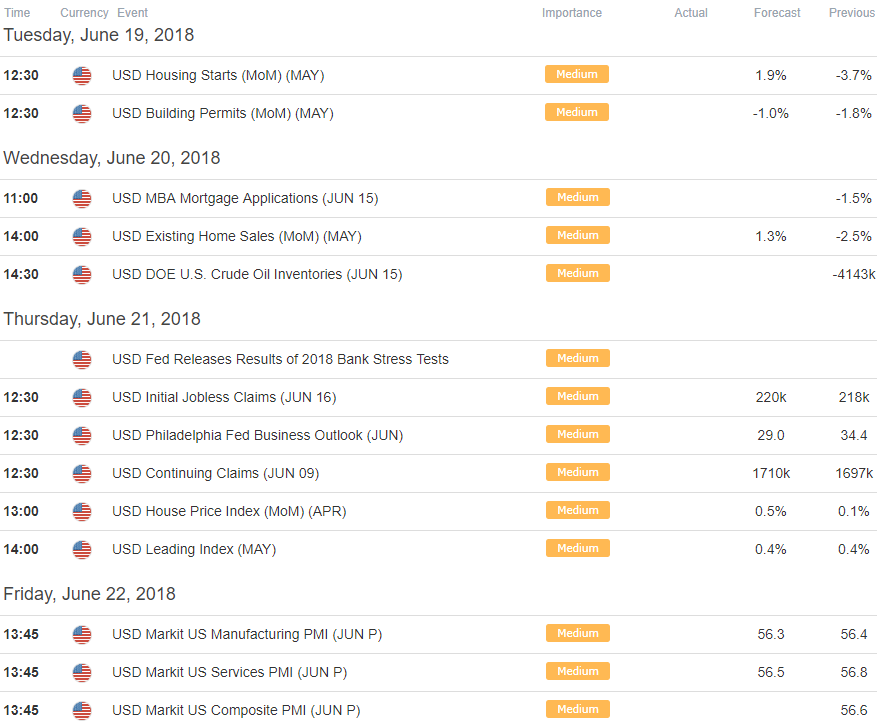
Economic Calendar – for the latest economic developments and upcoming event risk
Previous Weekly Technical Perspectives
- Weekly Technical Perspective on the Aussie (AUD/USD)
- Weekly Technical Perspective on the Euro (EUR/USD)
- Weekly Technical Perspective on AUD/JPY
- Weekly Technical Perspective on the Japanese Yen (USD/JPY)
- Weekly Technical Perspective on Crude Oil Prices
--- Written by Michael Boutros, Technical Currency Strategist with DailyFX
Follow Michael on Twitter @MBForex or contact him at mboutros@dailyfx.com


