


EUR/USD Technical Highlights:
- EUR/USD choppy trading could soon be nearing a resolution
- Looking increasingly like a bull-flag consolidation (or triangle)
- Levels and lines worth watching
See our Top Trading Opportunities for 2018 and expectations for market volatility this year on the DailyFX Trading Guides.
It’s been a difficult past several weeks trying to discern what the overall price action in the euro could mean in the grand scheme of things, with the past couple of weeks becoming even more congested. We’ve outlined the possibility of a topping formation as well as a bull-flag, both with specific events needed to validate.
With the passage of time and meander amid a strong trend, despite the stiff resistance by way of the 2008 trend-line, the bull-flag scenario is looking increasingly like it will come to fruition. A triangle is also taking shape, either way the outcome could be a positive one for the euro.
A rally could be set in motion at any time. We still need to see EUR/USD cross the 2008 trend-line with conviction, but the fact we haven’t seen aggressive selling just below such a key threshold implies it is more likely than not to break.
Traders are short EUR/USD, for more on how this could impact the outlook, see the IG Client Sentiment page.
EUR/USD Daily Chart
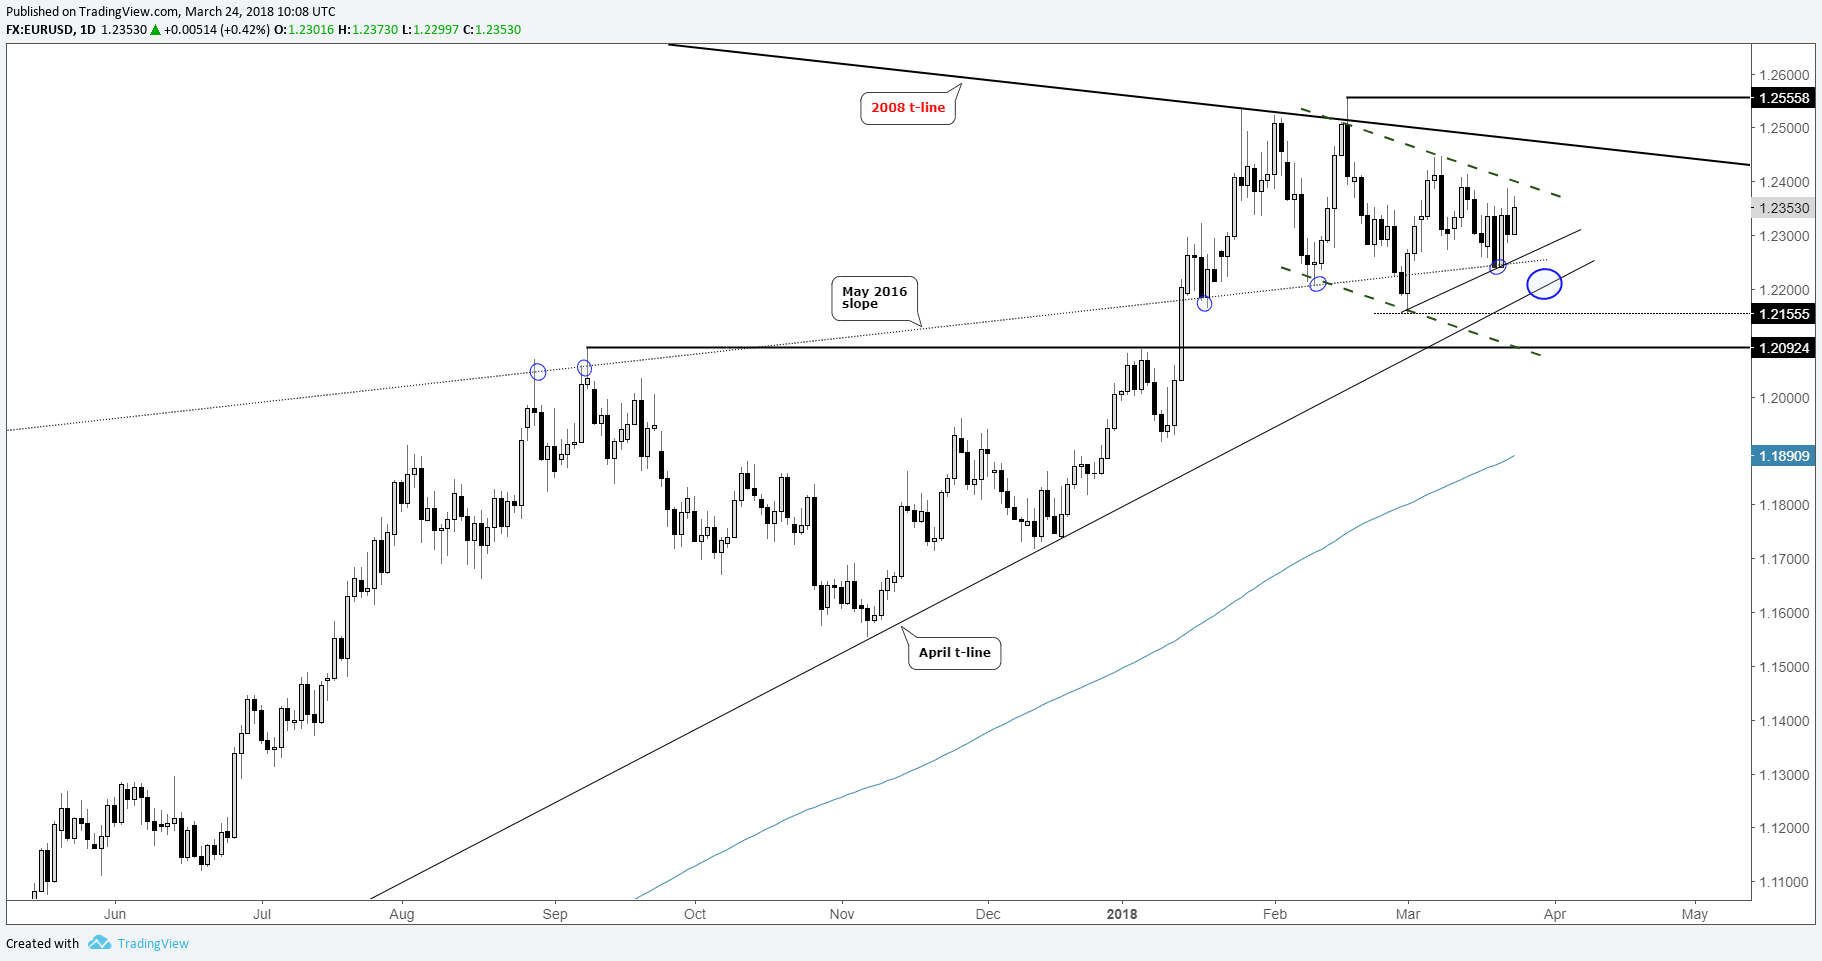
Trade above the Feb high at 12556 is viewed as the point where momentum could gain steam. This may or may not happen in the week ahead, but traders should be ready for a move at any time now. Without citing the obvious, the longer a market stays bottled up the closer you get to it getting unbottled.
In the event sellers show up in earnest and push the euro lower, attention will come on the May 2016 slope (last week’s low) and then the April trend-line. They are in relatively close proximity to one another, and with a little more time will be in confluence. It still requires a break of both lines and the 2017 high just under 12100, though, before we can turn bearish with conviction.
Traders continue to hold steady on shorts, as a contrarian indication it suggests we will see the euro rally in-line with what the charts are starting to suggest. We’ll continue to monitor the situation, and you can too on the IGCS Client Sentiment. Watch for any sudden material shifts which may unfold as price eventually breaks free from congestion.
Helpful Resources for Forex Traders
Whether you are a new or experienced trader, we have several resources available to help you; indicator for tracking trader sentiment, quarterly trading forecasts, analytical and educational webinars held daily, trading guides to help you improve trading performance, and one specifically for those who are new to forex.
---Written by Paul Robinson, Market Analyst
To receive Paul’s analysis directly via email, please SIGN UP HERE
You can follow Paul on Twitter at @PaulRobinsonFX


