


- EUR/USD – don’t forget monthly chart conditions
- AUD/USD finally comes off of resistance
- USD/CAD rips off of the support line
-- Subscribe to Jamie Saettele's distribution list in order to receive a free report to your inbox several times a week.
Monthly (LOG)
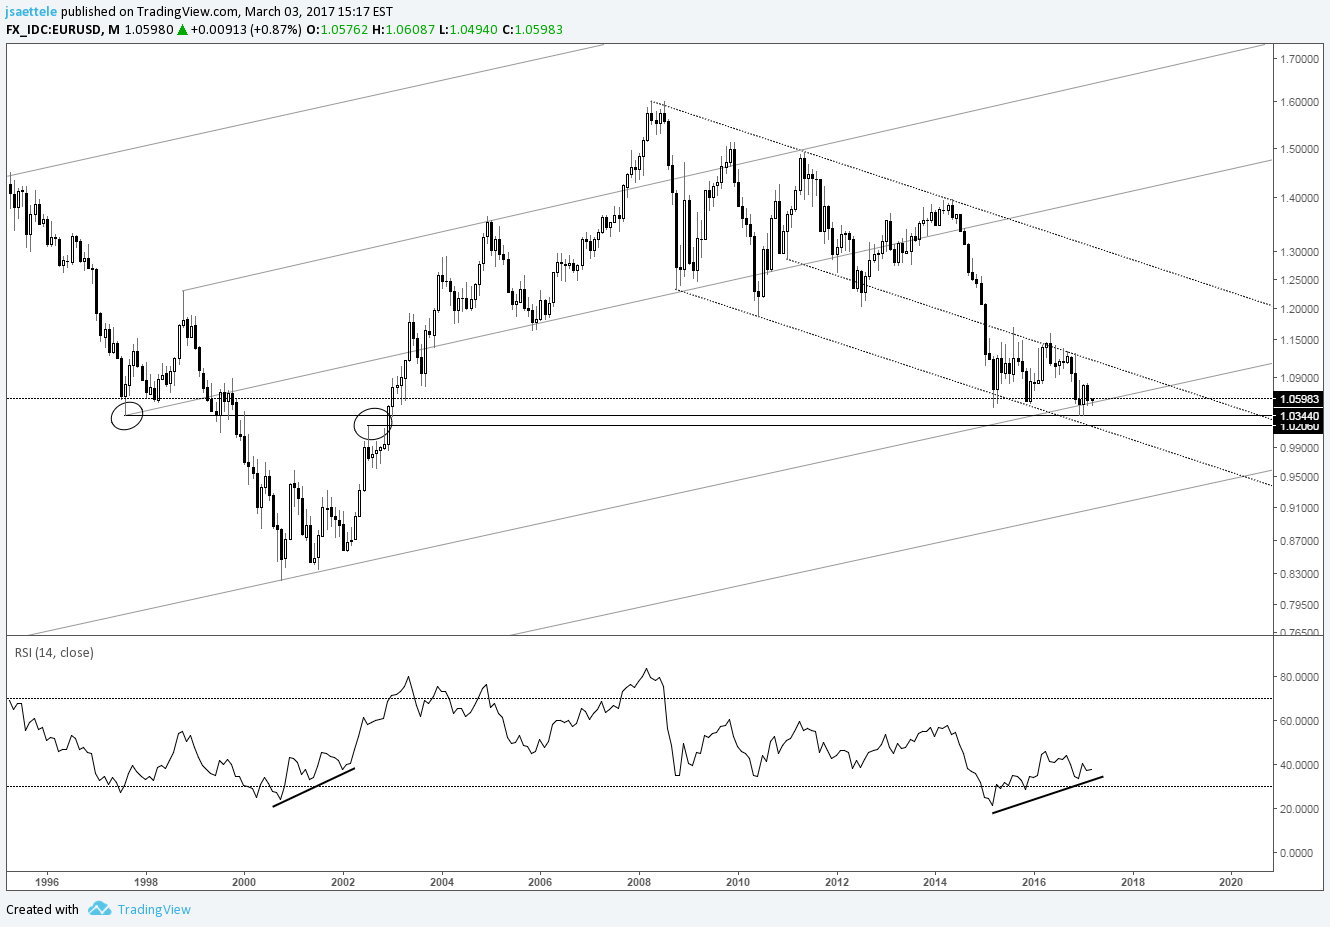
Chart Prepared by Jamie Saettele, CMT
See REAL TIME trader positioning
“1.0530 and 1.0460s. Those are the 2 levels that I’m paying attention to. 1.0530 is the December 2015 low and 61.8% of the rally from the January low. 1.0460s is the March 2015 low and year open price.” As we turn to a new month, I thought it a good idea to recall specific features of the EUR/USD monthly chart. First, a key reversal occurred in January. Second, there is divergence with RSI (monthly mind you). Third, the decline from 2008 channels. The described conditions suggest a major bottoming scenario but if a new low is made then pay attention to 1.0200 (channel line). The long term trigger for upside acceleration is the parallel near 1.1150.
Check out the DailyFX Trading Guides and webinars for ideas and education.
Weekly
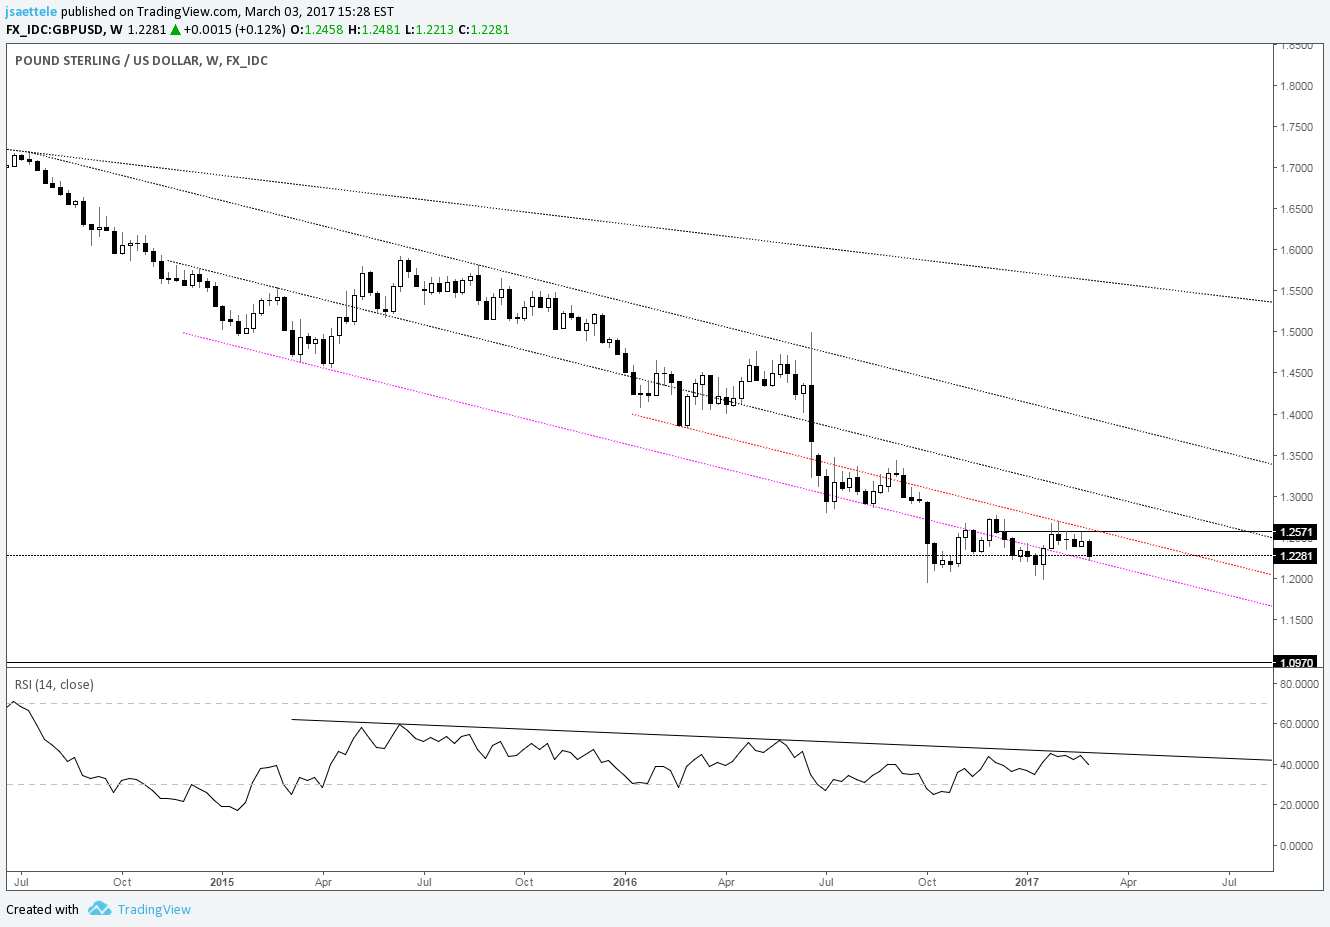
Chart Prepared by Jamie Saettele, CMT
See REAL TIME trader positioning
The Cable question is, ‘double bottom or consolidation on the way to 1.1000?’ 1.1000 is the top side of the 1980-1992 trendline (not shown on this chart). Parallels from the 2014-2015 trendline continue to define GBP/USD support and resistance. Only strength above the red parallel would indicate an important behavior change (relieve downside pressure) and trigger a double bottom with the October and January lows (target 1.3400-1.3500).
AUD/USD
Weekly
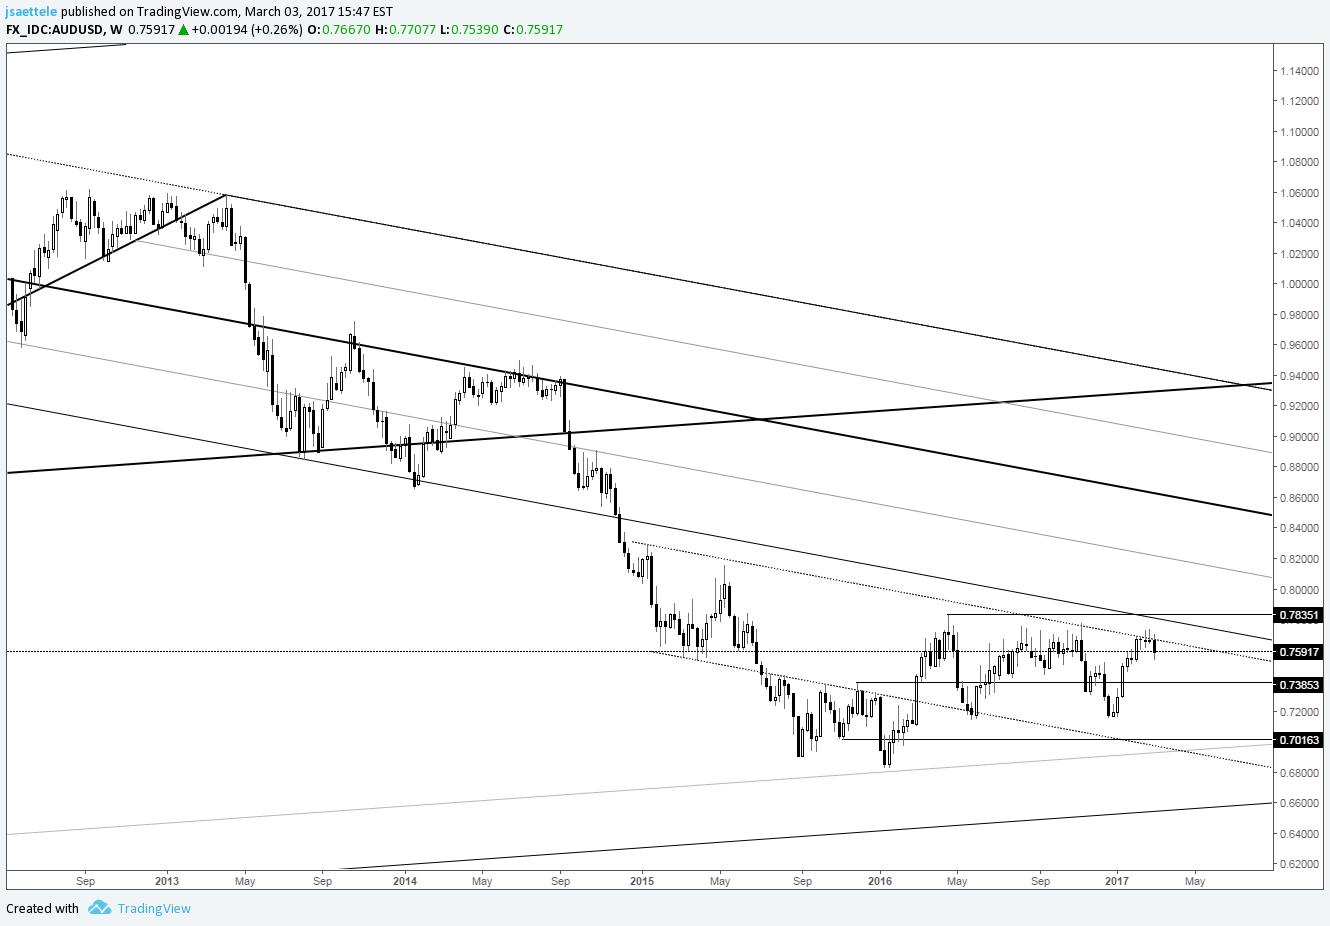
Chart Prepared by Jamie Saettele, CMT
See REAL TIME trader positioning
Last week’s note remarked that “the view that an important bullish base has formed remains but the action of the last 3 (was 1, then 2, and now 3) weeks at resistance (.7700-.7835) warns of a pause in what has been the trend of 2017.” Aussie finally came off of the level. The October and December 2015 highs at .7385 will be a level to pay attention to for support. Keep the RSI comments in mind. “Weekly RSI has peaked at/near 60 on every bounce since after the 2011 peak. RSI at the 2 most recent lows (January 2016 and January 2017) are near 40, which is a positive. In other words, the momentum profile has improved which increases risk of an upside break.”
Weekly

Chart Prepared by Jamie Saettele, CMT
See REAL TIME trader positioning
“Peaks in NZD/USD since the summer have been anything but clean but that may be changing as Friday’s high was right at the December high. Clean reactions at clean levels is a plus. I lean towards the downside with focus on the 55 week average (maybe a bit below).” NZD/USD has dropped to its 55 week average but parallel supports are still lower. Bigger picture, I’m not sure what to think. Is the rally from August 2015 countertrend or a new trend? The 2016 and YTD highs are at major resistance from the 2011 low and a double top target is still unmet at .5899. Also, weekly RSI failed before 70 at the latest top which is typical of a bear market rally. A break under the 2015-2016 trendline would suggest a good deal more downside. Until then, keep an open mind.
Weekly

Chart Prepared by Jamie Saettele, CMT
See REAL TIME trader positioning
Last week’s note remarked that “the USD/JPY close is the lowest since the first week of December. Possible channel support resides just below the market along with the February 2016 low at 110.99 and April 2016 high at 111.90. A reversal from this zone would be viewed as evidence that a broader range remains in play.” Range it is so upside is viable as long as the floor holds. Levels to pay attention to on the upside are more or less the big figures (115.00 and 116.00) and then the trendline at 117.50.
USD/CAD
Weekly
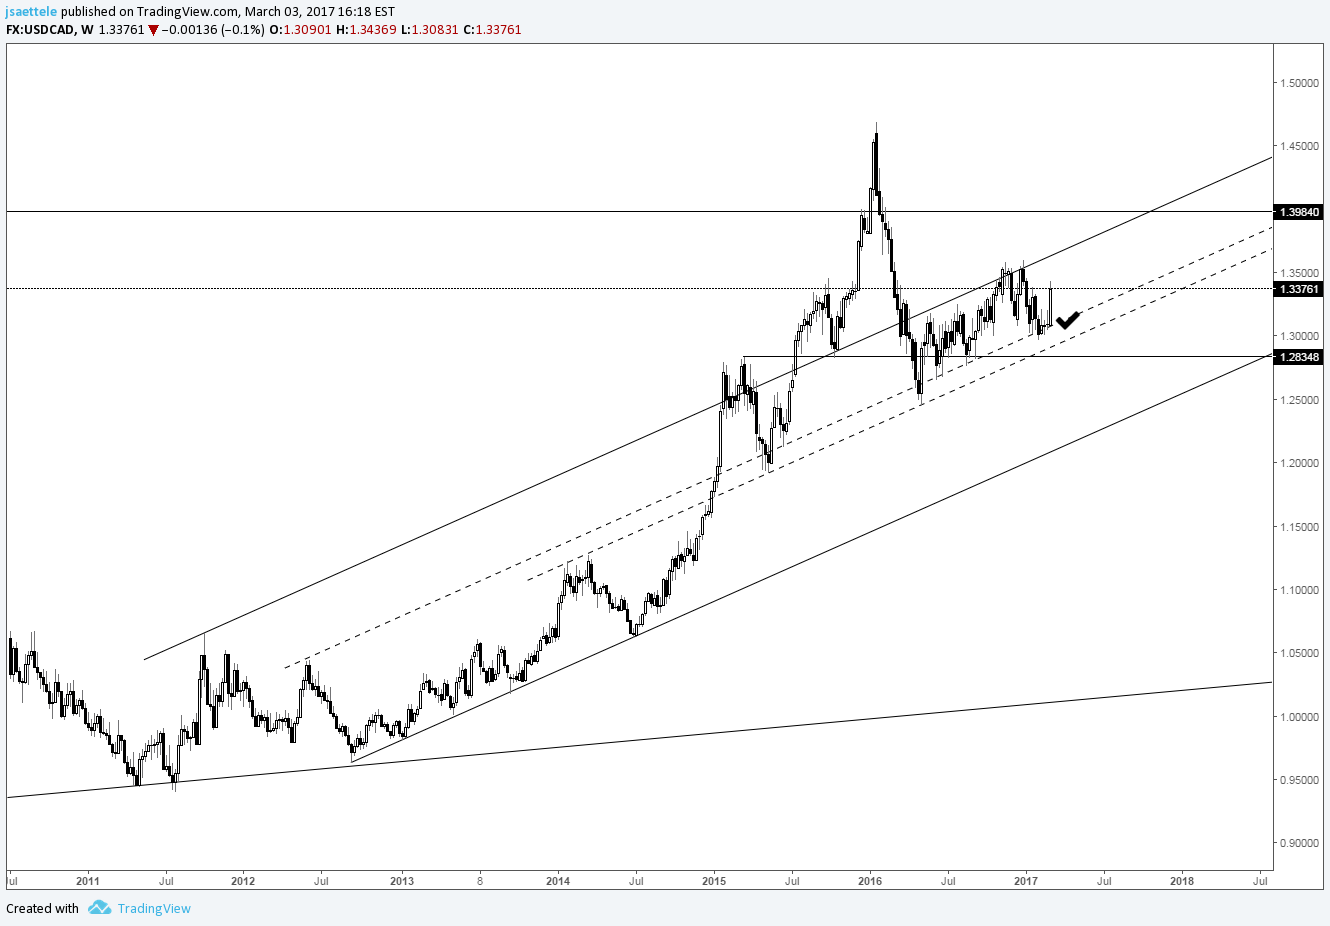
Chart Prepared by Jamie Saettele, CMT
See REAL TIME trader positioning
“The rally from May 2016 is corrective so the bias is for impulsive weakness but I don’t like being bearish into support (parallels).” The USD/CAD rally this week highlights why it’s not a great idea to be bearish into such clean support. Naturally, focus is now on the resistance parallel which is above the December high. The proximity of that parallel to the horizontal high increases risk of a bull trap on a push through the December high (failed breakout).
Weekly
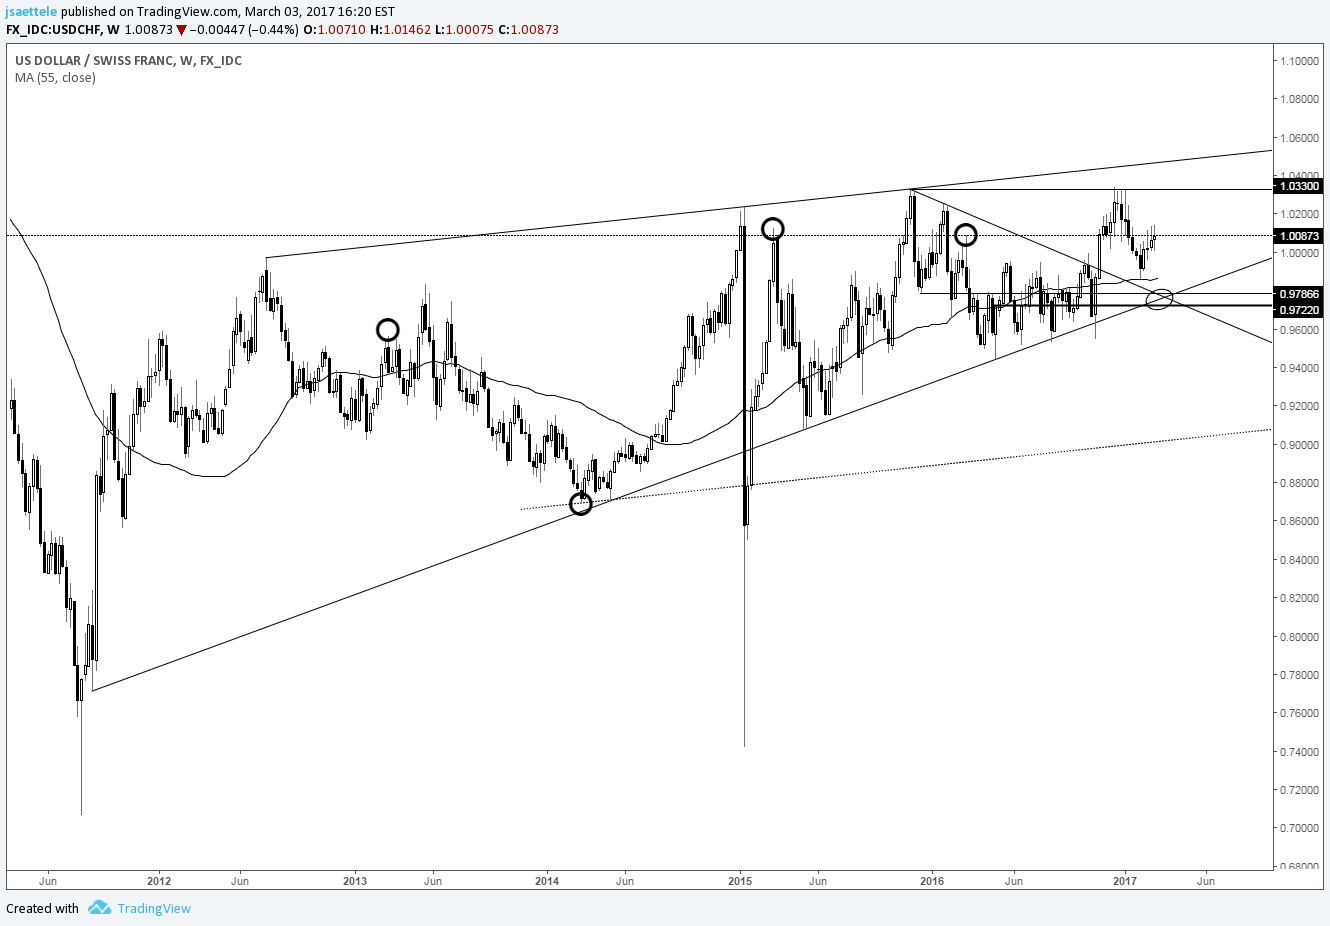
Chart Prepared by Jamie Saettele, CMT
See REAL TIME trader positioning
USD/CHF remains supported above the 55 week average but the rate has tended to pivot in the first half of March the last 4 years (see black circles). With Swissie rallying into this period, I’m keen on a top. Even so, this is no-man’s land. The levels to know are the nearly 6 year trendline (.9850 on log scale and just above .9700 on arithmetic) and topside of the wedge near 1.0450 (line off of 2012 and 2015 highs). A break of one of these technical barriers ideally leads to one of the largest moves in years (nearly 6 year wedge is underway).


