


- GBP/USD follows through on outside week
- USD/JPY responding to long term support again
- US Stocks – lower until 2018?
-- Subscribe to Jamie Saettele's distribution list in order to receive a free report to your inbox several times a week.
--For more analysis and trade setups (including current positions and the ‘watchlist’), visit SB Trade Desk
--Free trading tips
Weekly
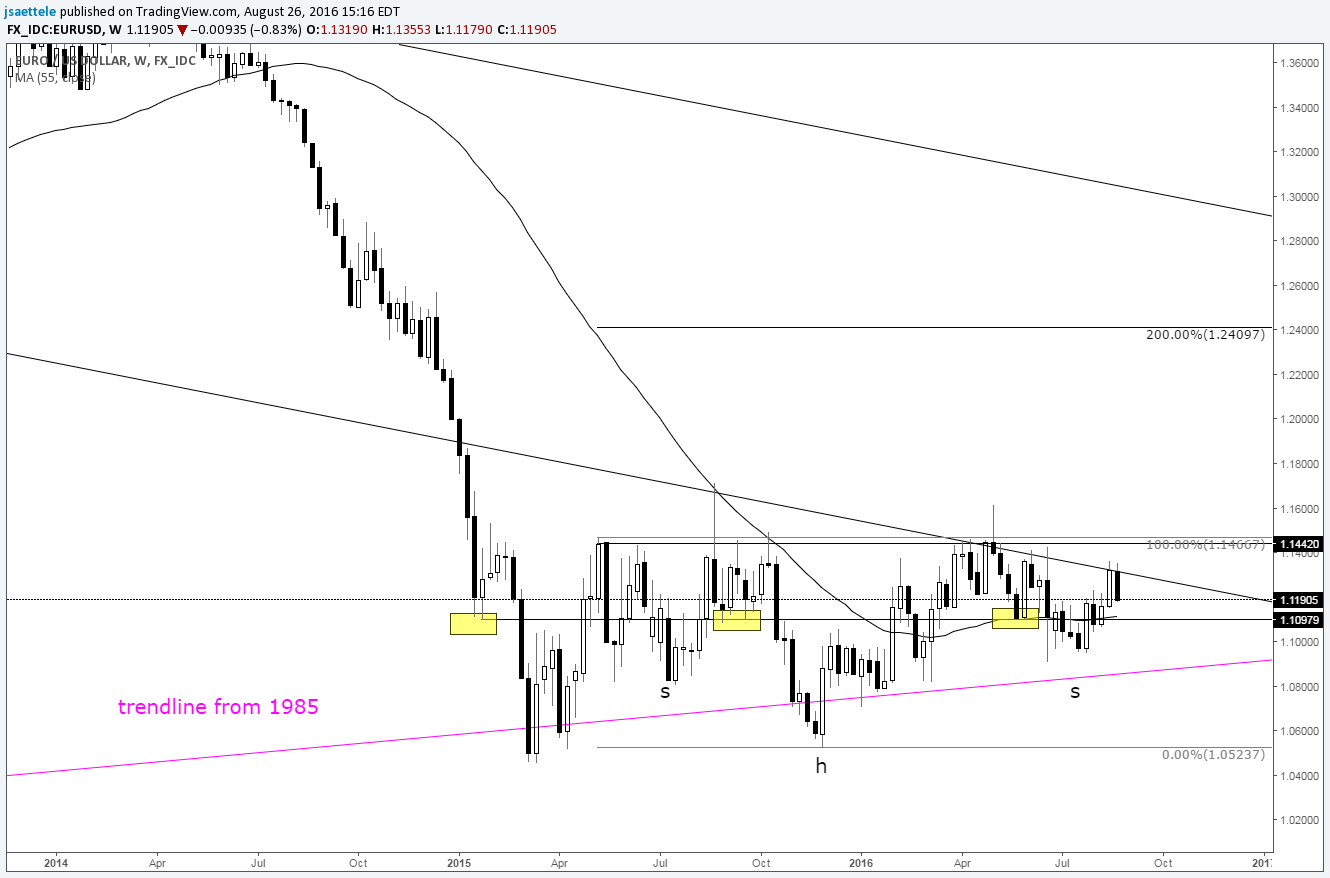
Chart Prepared by Jamie Saettele, CMT
See REAL TIME trader positioning
High Frequency Trading Tools
-Long term EUR/USD comments are unchanged. “EUR/USD has been trading sideways since March 2015. This is one of the longest sideways periods in history (as defined by the length of time between 52 week closing price extremes) and the eventual break will trigger a significant directional move. My contention has been that the move will be higher given the presence of the 31 year trendline as a floor.” The bullish outside week (week that ended 7/29) offers ‘something to work with’ on the bull side. Price is back above the 55 week average as well, which proved important as resistance and support at several junctures over the last year. SSI has flipped to negative, which is viewed as a positive for price. An inverse head and shoulders pattern is possible from the May 2015 high and could launch a major advance (strength through 1.1450 would confirm). As always, define your risk points (read more about traits of successful traders here).
-For forecasts and 2016 opportunities, check out the DailyFX Trading Guides.
GBP/USD
Weekly
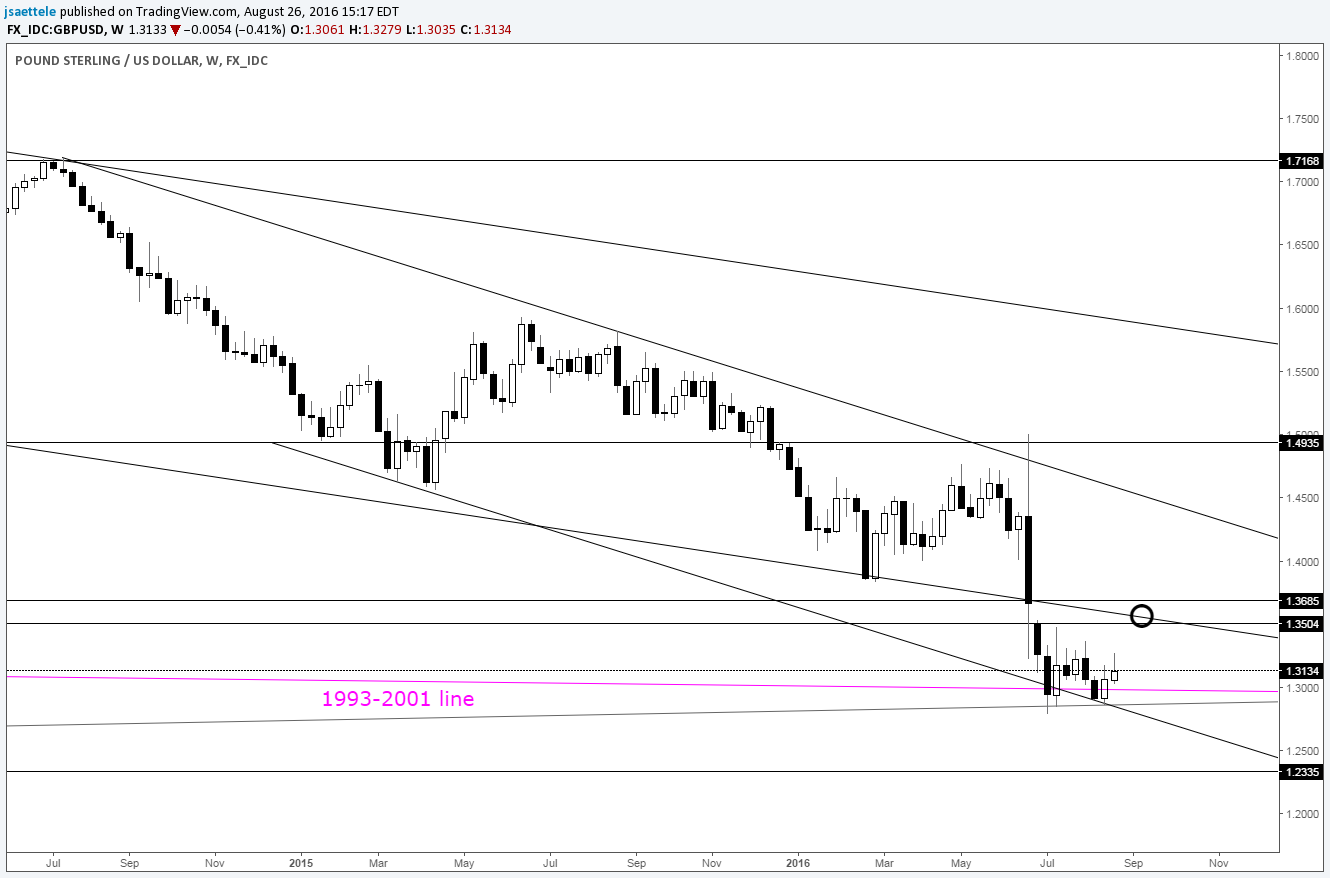
Chart Prepared by Jamie Saettele, CMT
See REAL TIME trader positioning
-The gap to open trading post-Brexit is thus far of the breakaway variety but the July low is just pips below the 78.6% retracement of the 1985-2007 range. A long term trendline (1993-2001 line) is also under price and the July candle sports a long lower wick, which can indicate demand. In other words, it’s possible that GBP/USD trades sideways or higher from here with 1.3500-1.3600 as a barrier to gains. If the July low gives, then there may be no support until early 2017 based on the 96 month (8 year) cycle low count.
Weekly
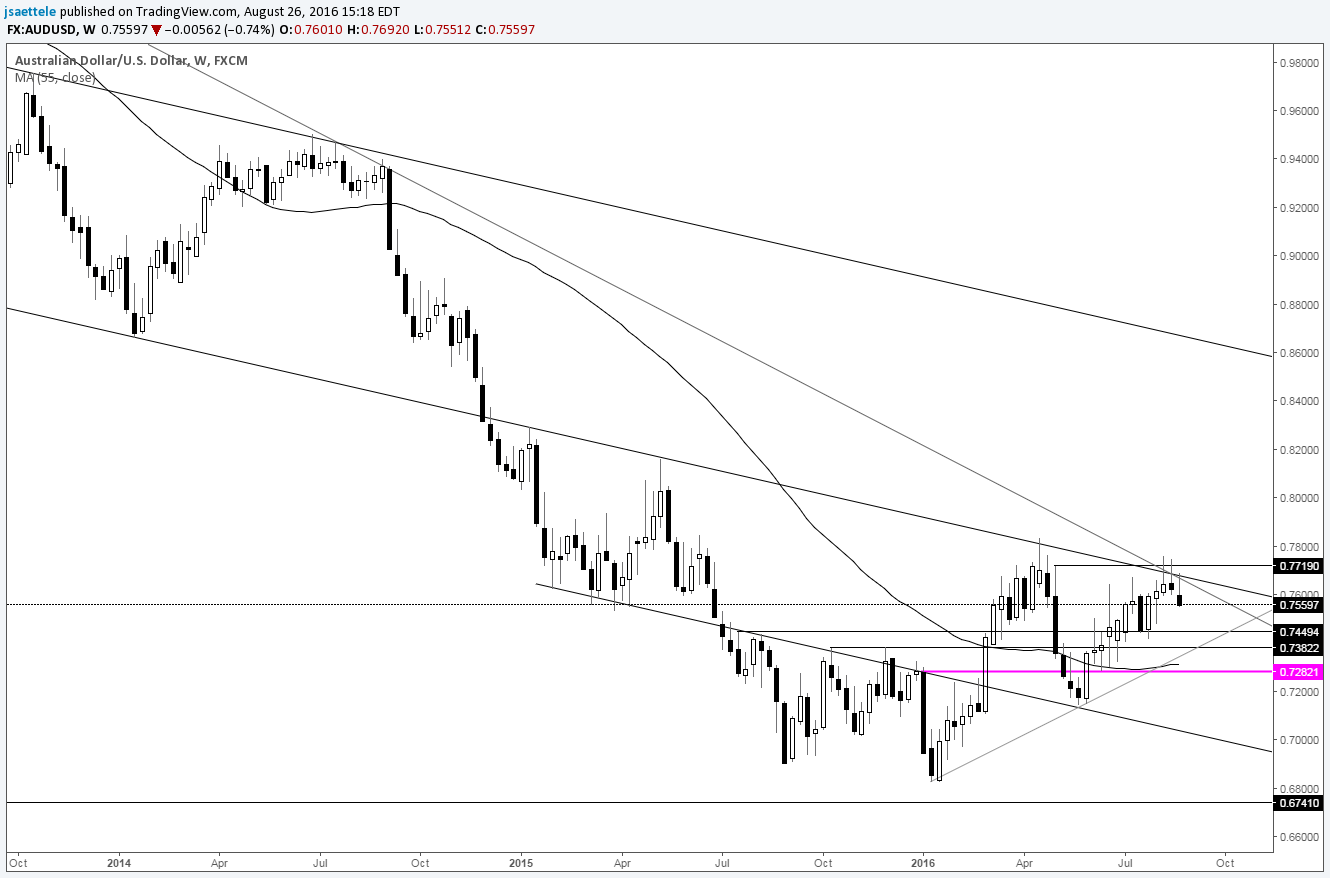
Chart Prepared by Jamie Saettele, CMT
See REAL TIME trader positioning
-Comments for the last 6 weeks have noted that “AUD/USD is approaching an important juncture defined by slope considerations and the pre-May rate cut high at .7719. This level may be resistance but a break above would leave Aussie in full blown bull camp with focus on the May 2015 high at .8163 and eventually .8600+.” The ‘important juncture’ continues to hold so risk is for additional range trade (below .7400 then think about support).
Weekly

Chart Prepared by Jamie Saettele, CMT
See REAL TIME trader positioning
-Kiwi continues to turn back from the 1985-1993 trendline. The line is acting as a serious energy point so the move that materializes from this point should be sharp. I’ve been thinking that the move will be lower for a test of .6900 (October and December 2015 highs) and this week’s sharp reversal casts a vote in favor of the bearish ‘opinion’.
USD/JPY
Weekly
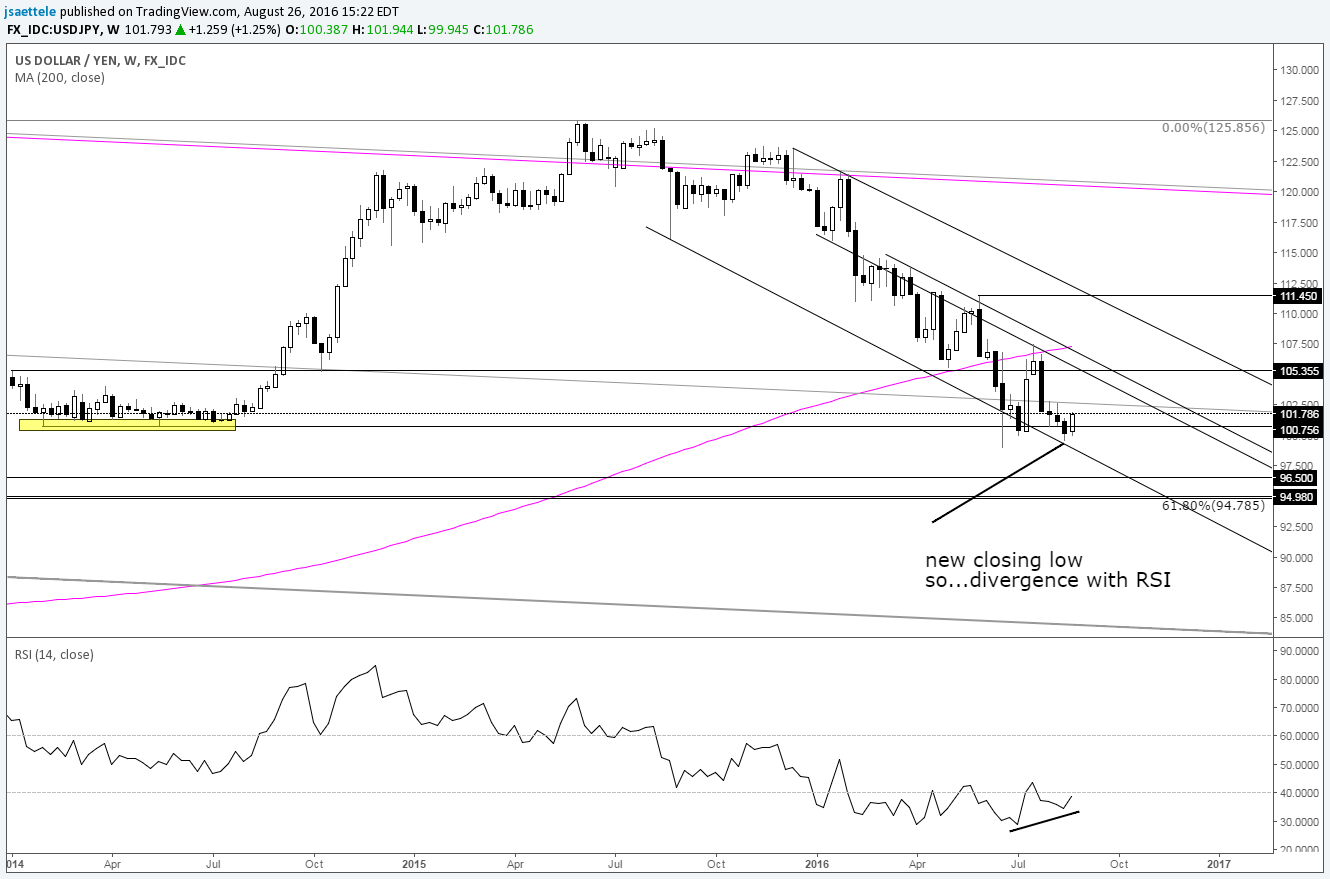
Chart Prepared by Jamie Saettele, CMT
See REAL TIME trader positioning
-“USD/JPY is holding up at the 2014 base and channel base. I’m inclined to look higher but would be aware of 105.40 (January 2014 high, October 2014 low and May 2016 low) as resistance.” Even longer term, I’ll point out that USD/JPY is testing its 60 month average. 60 months is 5 years. If the rally from 2011 is from a ‘macro’ double bottom then a turn higher here isn’t inconceivable. For example, the downtrend into the 1995 low was interrupted by a correction into the 1990 high that ended near the 60 month (5 year) average. Divergence with RSI on the weekly is present now too.
Weekly

Chart Prepared by Jamie Saettele, CMT
See REAL TIME trader positioning
-Recent action suggests that the bearish wedge is in play. As noted previously, “the dynamic with the 55 average is interesting. This average was resistance in May and July. The average was support for the last 3 years so the fact that the average has been acting as resistance warns that a bearish cycle may be underway. Price action since the May low could also end up as a wedge.”
Weekly
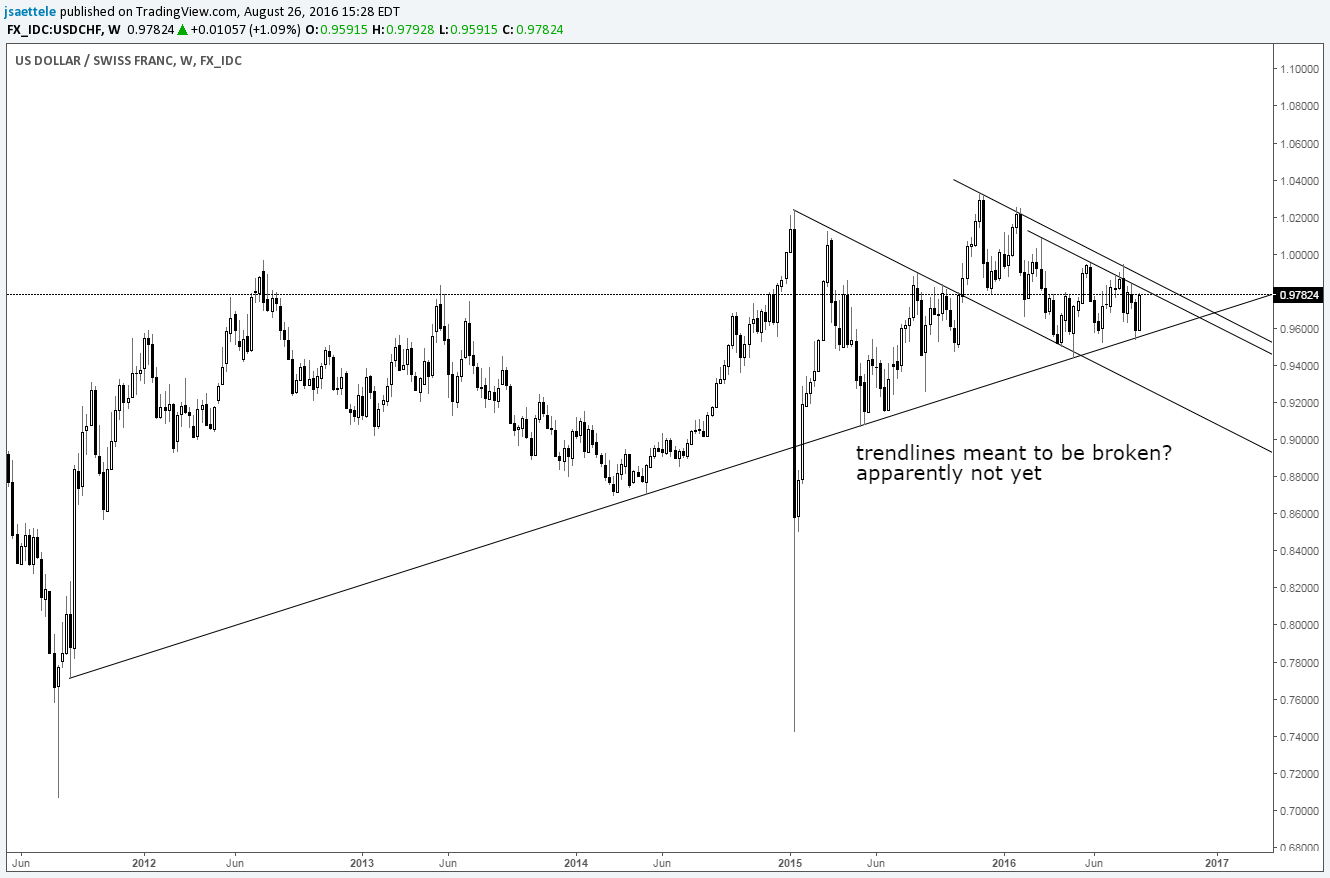
Chart Prepared by Jamie Saettele, CMT
See REAL TIME trader positioning
-The 2011-2014 trendline is quite the barrier. This line held yet again on this latest drop. As noted in for most of 2016, “failed breakout attempts late in 2015 and early in 2016 warn of an eventual downside break and that downside break.” I thought we may have been on our way with USD/CHF testing the line so soon after the May touch. Pay attention to the slope lines just above price (up to about .9900 next week). Strength through there could set off a major rally. Bottom line, Swissie is coiled to the extreme (as are a number of currencies). Long consolidations lead to strong trending moves. Direction is unclear however.
BONUS Chart
Dow Jones Industrial Average Yearly
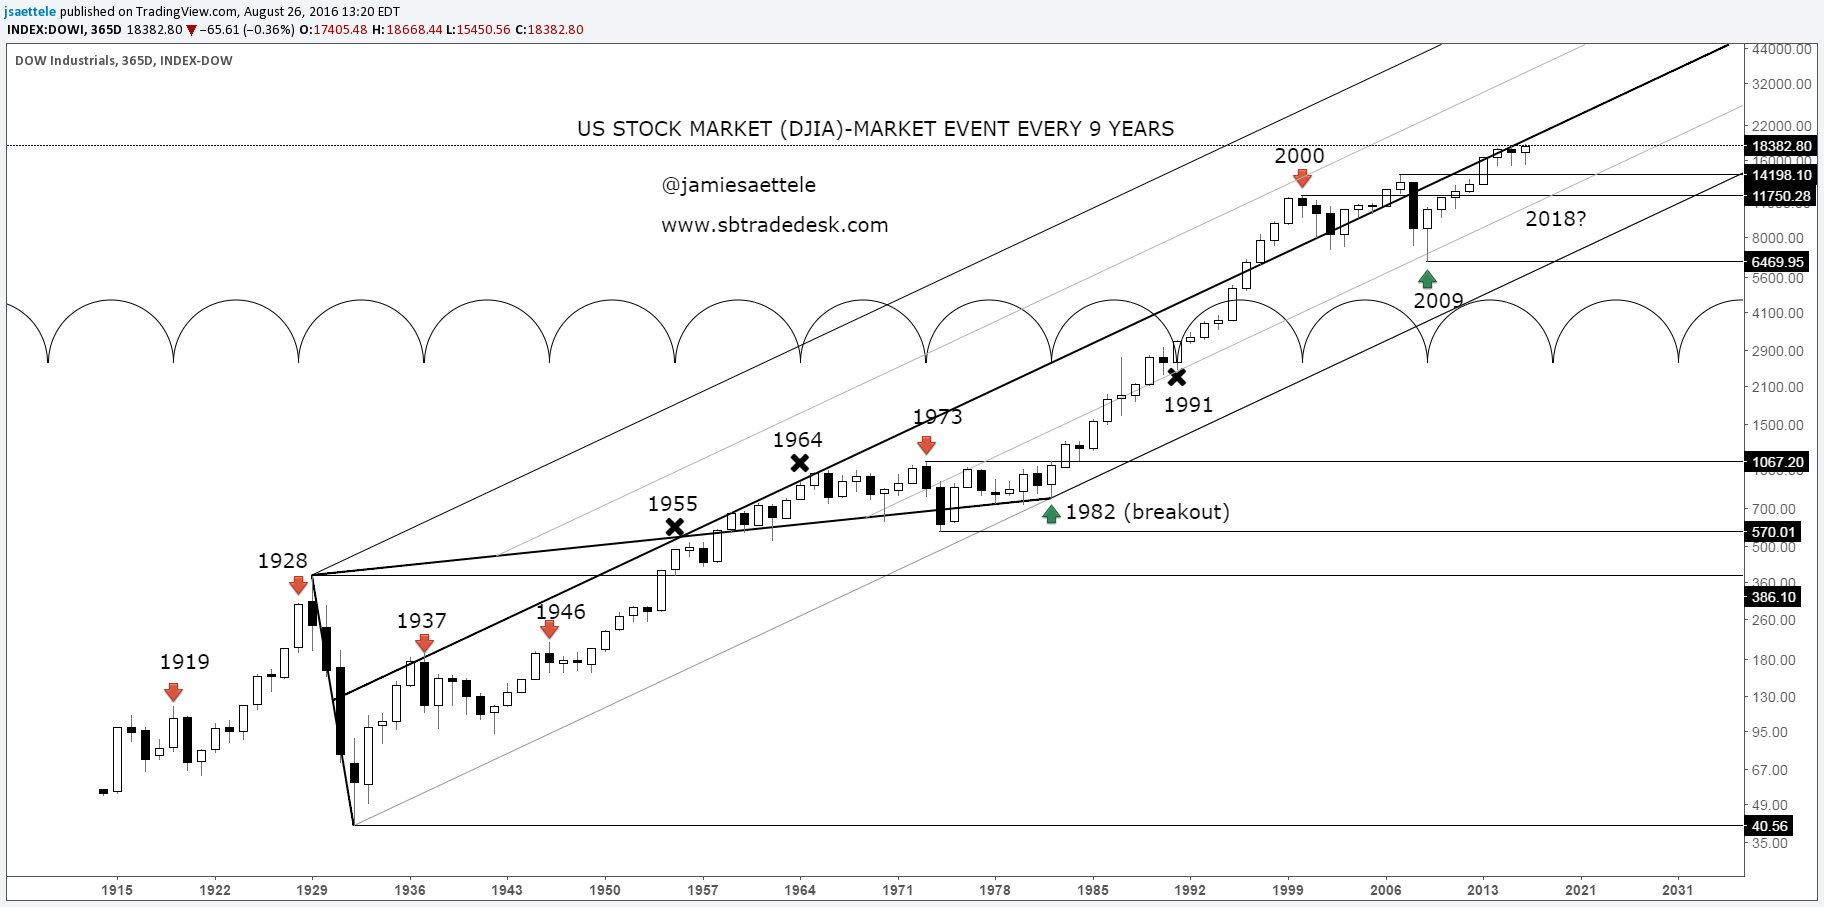
There is a tendency for the US stock market (represented here by the Dow Jones Industrial Average) to ‘pivot’ every 9 years. The next year in the cycle is 2018. The question then, is 2018 going to be a high or a low? That’s a question that I attempt to answer in a special report that was just published to SB Trade Desk. In the report, I look at a period that resembles current action (some may call it an analog or comparative). The period that we’re looking at is over 100 years ago but the similarities are striking! Anyway, keep this chart handy for the long haul (real long haul).


