


- AUD/USD reacts at major resistance
- USD/JPY and the 5 year average
- USD/CNH – one year after the devaluation
-- Subscribe to Jamie Saettele's distribution list in order to receive a free report to your inbox several times a week.
--For more analysis and trade setups (including current positions and the ‘watchlist’), visit SB Trade Desk
--Free trading tips
Weekly

Chart Prepared by Jamie Saettele, CMT
See REAL TIME trader positioning
High Frequency Trading Tools
-Long term EUR/USD comments are unchanged. “EUR/USD has been trading sideways since March 2015. This is one of the longest sideways periods in history (as defined by the length of time between 52 week closing price extremes) and the eventual break will trigger a significant directional move. My contention has been that the move will be higher given the presence of the 31 year trendline as a floor.” The bullish outside week (week that ended 7/29) offers ‘something to work with’ on the bull side. Price is back above the 55 week average as well, which proved important as resistance and support at several junctures over the last year. SSI has flipped to negative, which is viewed as a positive for price. An inverse head and shoulders pattern is visible from the May 2015 high and could launch a major advance. As always, define your risk points (read more about traits of successful traders here).
-For forecasts and 2016 opportunities, check out the DailyFX Trading Guides.
Weekly

Chart Prepared by Jamie Saettele, CMT
See REAL TIME trader positioning
-The gap to open trading post-Brexit is thus far of the breakaway variety but the July low is just pips below the 78.6% retracement of the 1985-2007 range. A long term trendline (1993-2001 line) is also under price and the July candle sports a long lower wick, which can indicate demand. In other words, it’s possible that GBP/USD trades sideways or higher from here. If the July low gives, then there may be no support until early 2017 based on the 96 month (8 year) cycle low count.
AUD/USD
Weekly
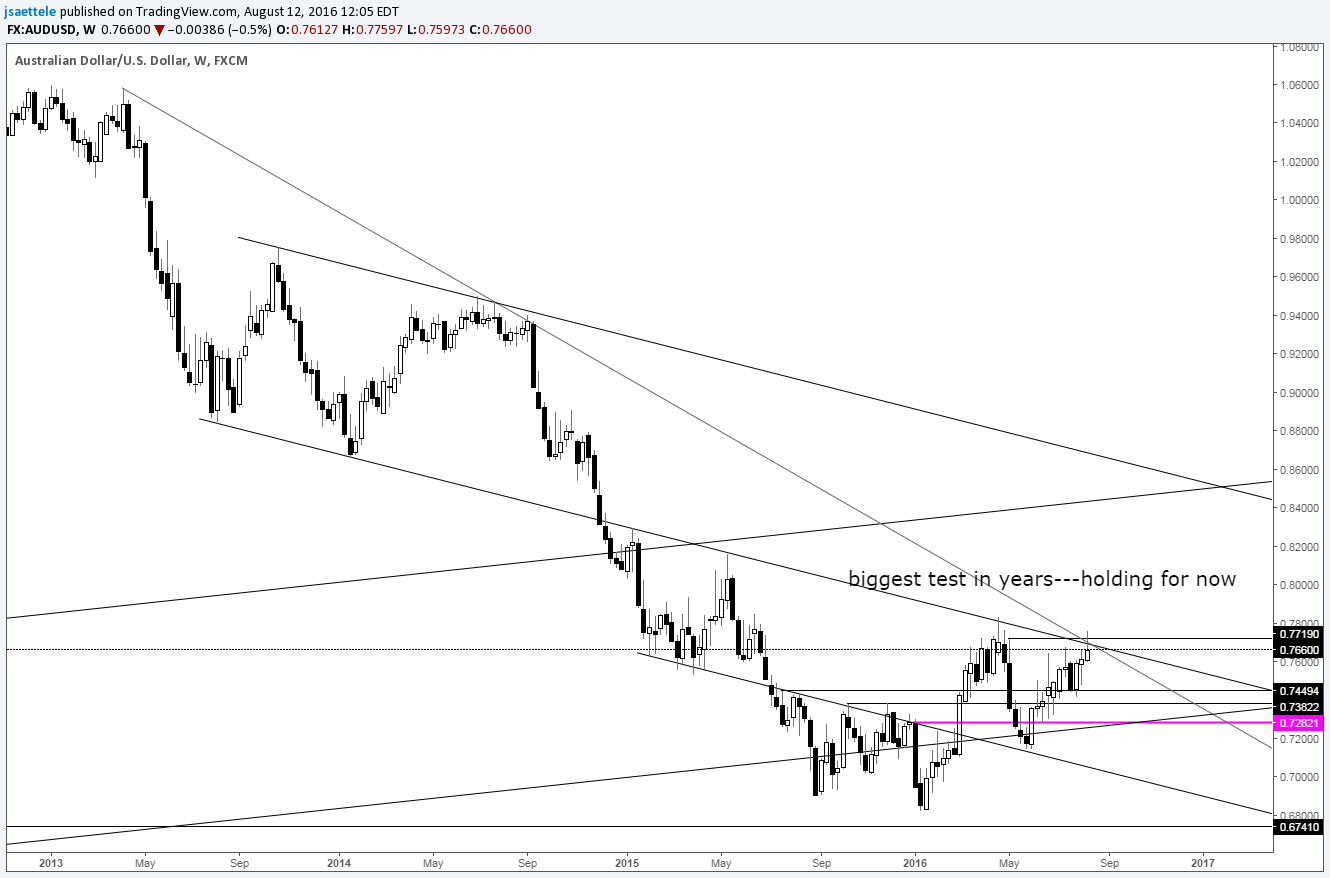
Chart Prepared by Jamie Saettele, CMT
See REAL TIME trader positioning
-Comments for the last 6 weeks have noted that “AUD/USD is approaching an important juncture defined by slope considerations and the pre-May rate cut high at .7719. This level may be resistance but a break above would leave Aussie in full blown bull camp with focus on the May 2015 high at .8163 and eventually .8600+.” The ‘important juncture’ held this week so risk is for more range trade. I do believe that this resistance gives way eventually. The flatter line is being tested for a 6th time…levels are meant to be broken.
Weekly
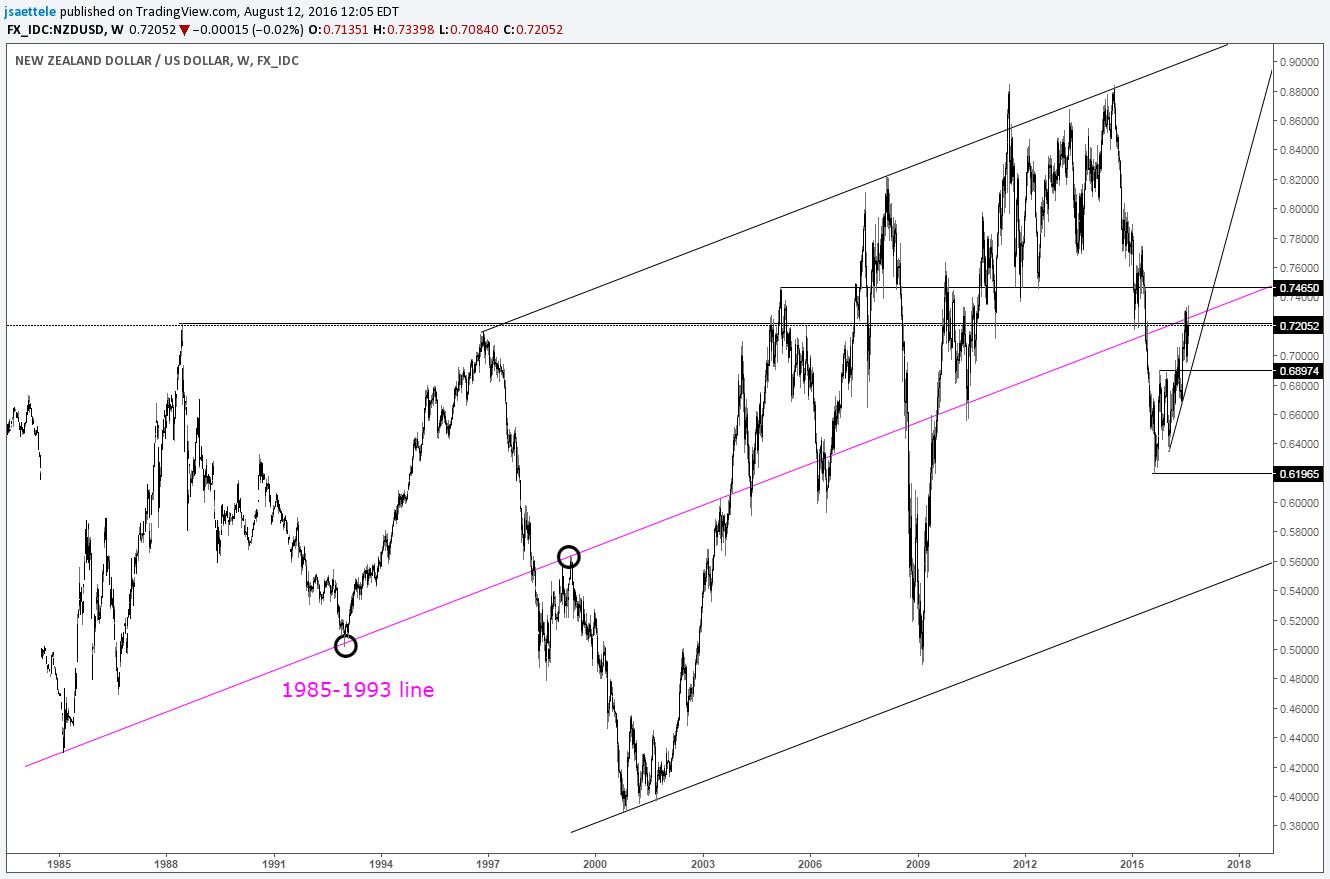
Chart Prepared by Jamie Saettele, CMT
See REAL TIME trader positioning
-I wrote last week that “NZD/USD has turned down from a long term parallel and major horizontal levels. I had been looking for .6900 (resistance in 2015) to provide support but Kiwi has turned up sharply before the level. That turn higher might end up contributing to a more bearish outcome for the bird as operations constructed a possible head and shoulders top from the June high.” On a weekly basis, nothing has changed. RBNZ sent Kiwi flying to its best level since May 2015 if for a fleeting moment.
USD/JPY
Monthly
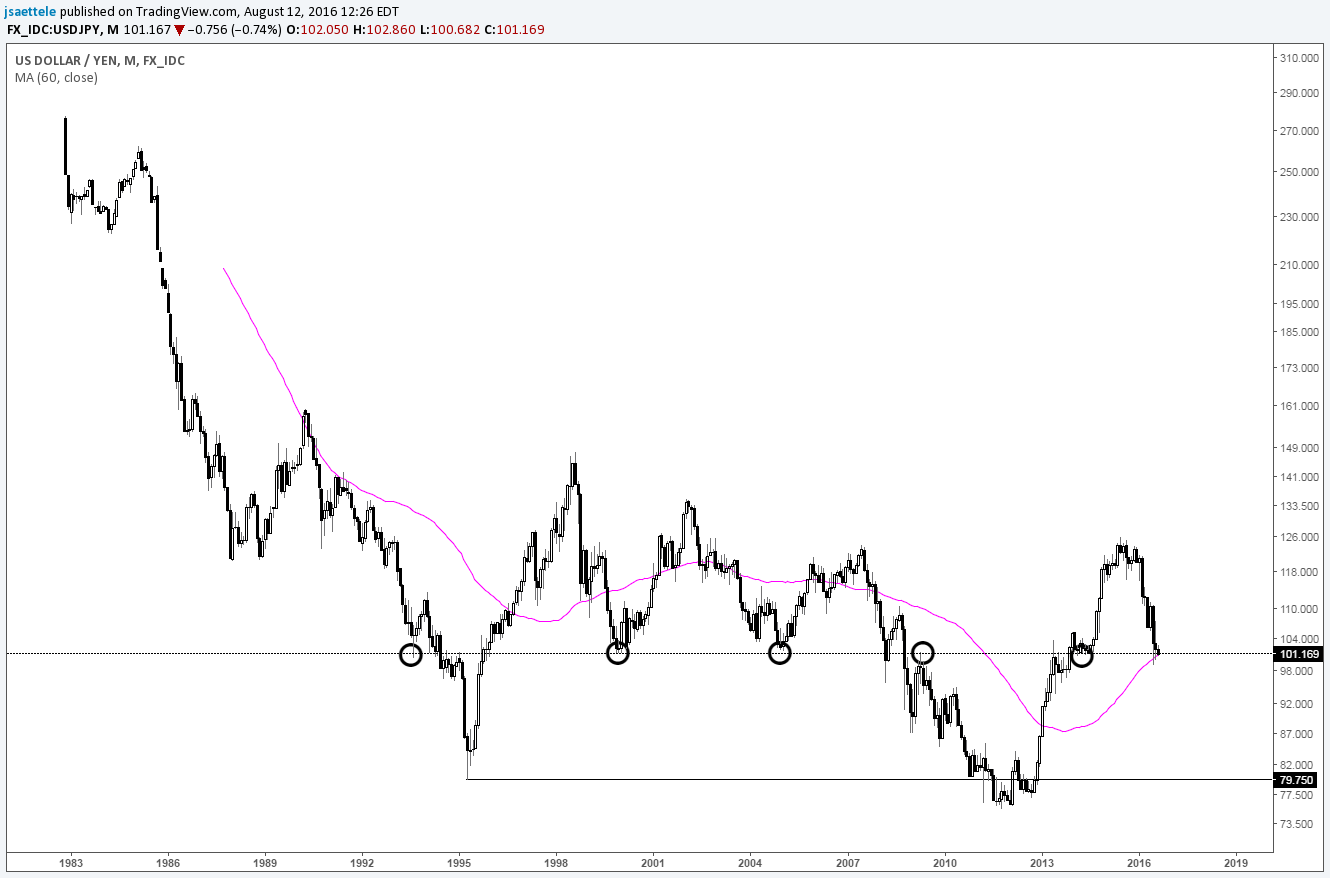
Chart Prepared by Jamie Saettele, CMT
See REAL TIME trader positioning
-“USD/JPY is holding up at the 2014 base and channel base. I’m inclined to look higher but would be aware of 105.40 (January 2014 high, October 2014 low and May 2016 low) as resistance.” Even longer term, I’ll point out that USD/JPY is testing its 60 month average. 60 months is 5 years. If the rally from 2011 is from a ‘macro’ double bottom then a turn higher here isn’t inconceivable. The downtrend into the 1995 low was interrupted by a correction into the 1990 high that ended near the 60 month (5 year) average.
Weekly

Chart Prepared by Jamie Saettele, CMT
See REAL TIME trader positioning
-There is no change to the USD/CAD weekly analysis. “The dynamic with the 55 average is interesting. This average was resistance in May and July. The average was support for the last 3 years so the fact that the average has been acting as resistance warns that a bearish cycle may be underway. Price action since the May low could also end up as a wedge. A bearish wedge would be confirmed on a break under the wedge support, which is near 1.2900. A break through 1.3300 would trigger a breakout from a running wedge…which would be bullish.”
Weekly

Chart Prepared by Jamie Saettele, CMT
See REAL TIME trader positioning
-Failed breakout attempts late in 2015 and early in 2016 warned of an eventual downside break. However, downside probes (April through June) have held a multi-year support line (back at that line again). The holding pattern that has persisted since March 2015 will eventually give way to the next trending phase towards either the low .80s or 1.16-1.17.
Bonus Chart
USD/CNH
Weekly
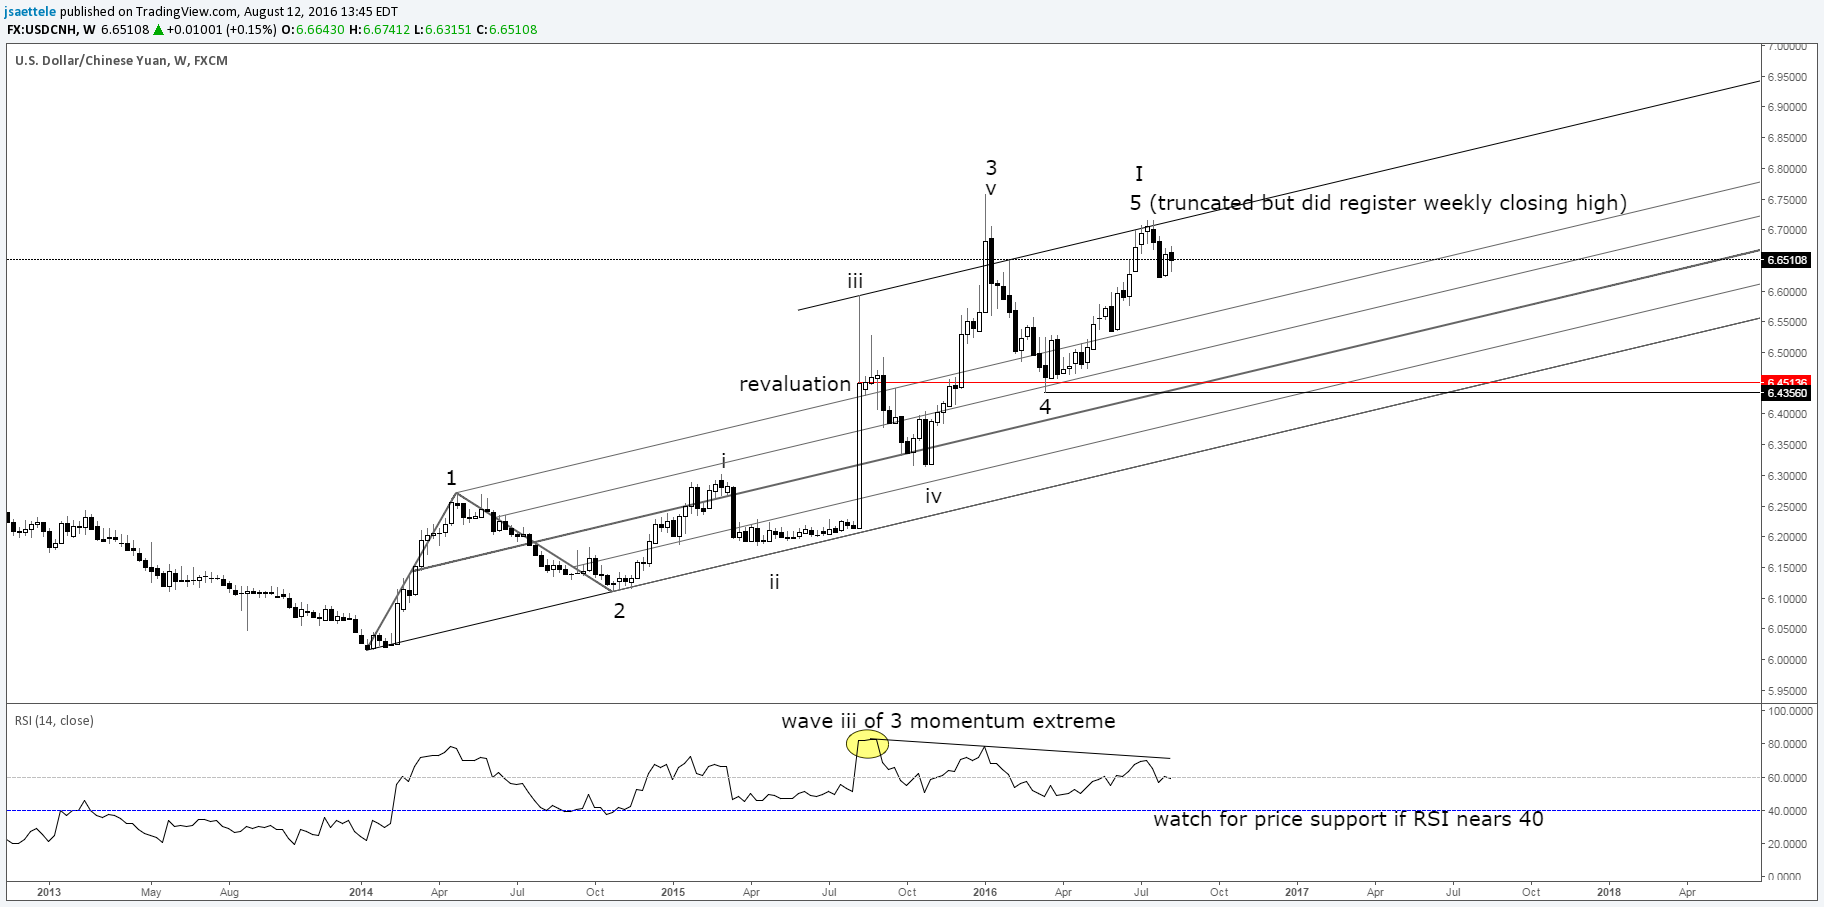
Chart Prepared by Jamie Saettele, CMT
See REAL TIME trader positioning
One year ago yesterday (8/22/2015), China devalued its currency by about 2%. The move sparked risk aversion the world over and many China bears labeled short yuan the ‘trade of the century’. Indications are that short yuan (long USD/CNH although I’d argue that there are better currencies to buy against the yuan) is an exceptional long term opportunity but the acceleration phase of this rally may have to wait.
The Elliott wave model of market behavior states that the larger degree trend unfolds in 5 wave movements (3 motive and 2 corrective). Once 5 waves complete, the expectation is that 3 waves will unfold in the opposite direction before the larger degree trend resumes. The USD/CNH rally from the 2014 low is about as clean a 5 wave rally as you’ll ever see. Wave 3 is the extended wave (subdivides into 5 waves itself), which is common. Wave iii of 3 features the strongest momentum (highest RSI value in this chart) and divergence with RSI is present at the peak of proposed wave 5. SB Trade Desk subscribers (click here if interested) know all too well my rants on divergence but there are very specific conditions that need to be met in order to actually trade divergence…those conditions are not present here. Another thing about divergence that many overlook is the closing price must be used in order to identify divergence (the RSI calculation uses closing prices). In this case, it’s appropriate to claim divergence due to the lower high in RSI and higher closing high.
So, the Elliott wave interpretation is to expect a drop back to 6.4356 before looking for the next big low. Incidentally, this price is near the 8/11/2015 devaluation. USD/CNH closed that week at 6.4514.
USD/CNH
Weekly Closes

Chart Prepared by Jamie Saettele, CMT


