


- EUR/USD 1.0870/80 could be big
- NZD/USD follows through on weekly reversal
- USD/CAD breakout-heads up on mid-1.3200s.
-- Subscribe to Jamie Saettele's distribution list in order to receive a free report to your inbox several times a week.
--For more analysis and trade setups (including current positions and the ‘watchlist’), visit SB Trade Desk
--Free trading tips
Weekly

Chart Prepared by Jamie Saettele, CMT
See REAL TIME trader positioning
High Frequency Trading Tools
-EUR/USD has been trading sideways since March 2015. This is one of the longest sideways periods in history (as defined by the length of time between 52 week closing price extremes) and the eventual break will trigger a significant directional move. My contention has been that the move will be higher given the presence of the 31 year trendline. Strength above 1.1185 would suggest that the upside is viable. Until then, there is nothing bullish to work with on the near term charts but be aware of 1.0870/80 as a reaction level. As always, define your risk points (read more about traits of successful traders here).
-For forecasts and 2016 opportunities, check out the DailyFX Trading Guides.
Weekly

Chart Prepared by Jamie Saettele, CMT
See REAL TIME trader positioning
-The gap to open trading post-Brexit is thus far of the breakaway variety. The current level (slope lines) and/or 1.2500 could inspire a ‘squeeze’ as part of consolidation before another leg lower. 1.2500 relates the 2009-2014 range (127.2% of that range from the 2014 high) and decline from 2007 (decline from 2014 = .618% of 2007-2008 decline). Former supports at 1.3500-1.3700 should now be watched for resistance. Remember, there is a 96 month (8 year) cycle low count.
Weekly

Chart Prepared by Jamie Saettele, CMT
See REAL TIME trader positioning
-Price action since early 2015 may compose a broad bottoming process. Strength through .7750 or so (parallel resistance) would strongly suggest that the next move is towards the mid .80s. Until then, market conditions are best described as range with supports at .7450 (now), .7380, and .7280 and resistance near .7719.
NZD/USD
Weekly

Chart Prepared by Jamie Saettele, CMT
See REAL TIME trader positioning
-The last NZD/USD weekly update noted that “a long term parallel and major horizontal levels (including the 1988 high) could cap the rally from August 2015…Kiwi has been trading around this long term inflection point (line off of the 1985 and 1993 lows) for 4 weeks and this week’s weekly key reversal might cap the rally.” Weakness followed through on last week’s reversal. Watch .6900 for clues on the next move.
Weekly

Chart Prepared by Jamie Saettele, CMT
See REAL TIME trader positioning
-Recent updates have noted that “price has stabilized in the vicinity of the noted 2000 and 2014 lows but whether or not the last week is a pause or a change in trend is unanswerable right now. Strength above 105.40 is needed in order to suggest that the upside is again viable. Until then, the area around 95 (next historical inflection point and 61.8% of rally from 2011) looms as a magnet.” USD/JPY turned up sharply from the well-defined long term horizontal level and traction above 105.40 is a positive. Focus in the weeks and months ahead is higher (although the daily gyrations will probably prove tricky).
USD/CAD
Weekly
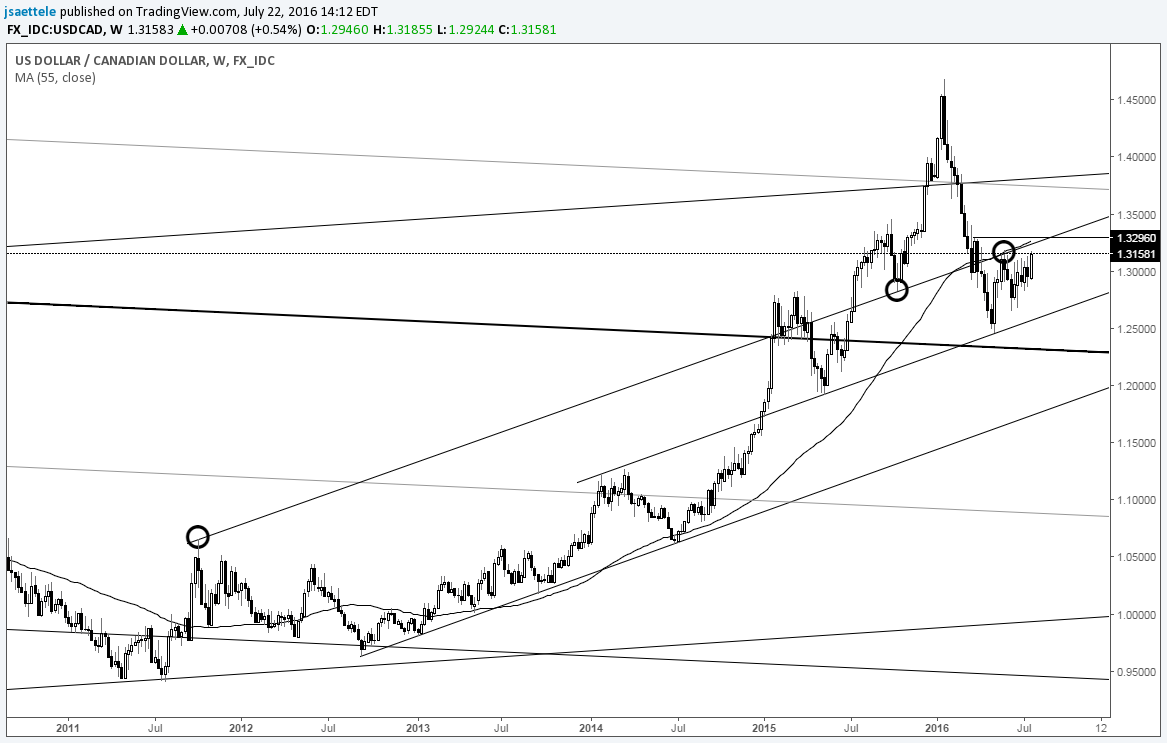
Chart Prepared by Jamie Saettele, CMT
See REAL TIME trader positioning
-The most recent weekly comments noted that “the bullish engulfing candle from May is still there of course but the rally has failed at the 55 week average. FXTW pays attention to this because this average was support for the last 3 years. Former support just provided resistance so USD/CAD may be transitioning to a bearish phase.” USDCAD is attempting to break higher from 11 weeks of sideways trade. Upside potential is bolstered by a breakdown in crude but don’t forget about the 55 week average as a level that could induce failure.
Weekly
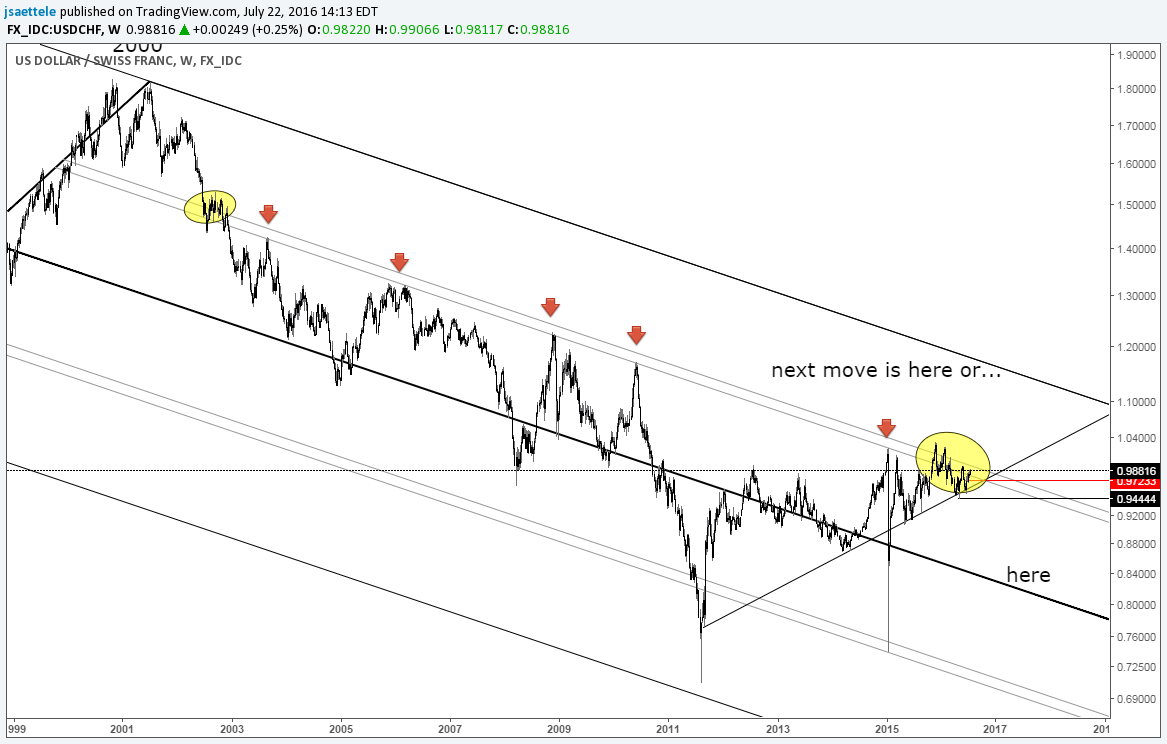
Chart Prepared by Jamie Saettele, CMT
See REAL TIME trader positioning
-Oh USD/CHF where are you going? Failed breakout attempts late in 2015 and early in 2016 warned of an eventual downside break. However, downside probes (April through June) have held a multi-year support line. The holding pattern that has persisted since March 2015 will eventually give way to the next trending phase towards either the low .80s or 1.16-1.17. I’m not smart enough to know which way the market will break and I’m not dumb enough to pretend to know. Trend developments are positive while above .9683.


