


-- Subscribe to Jamie Saettele's distribution list in order to receive a free report to your inbox several times a week.
--For more analysis and trade setups (including current positions and the ‘watchlist’), visit SB Trade Desk
--Free trading tips
Weekly
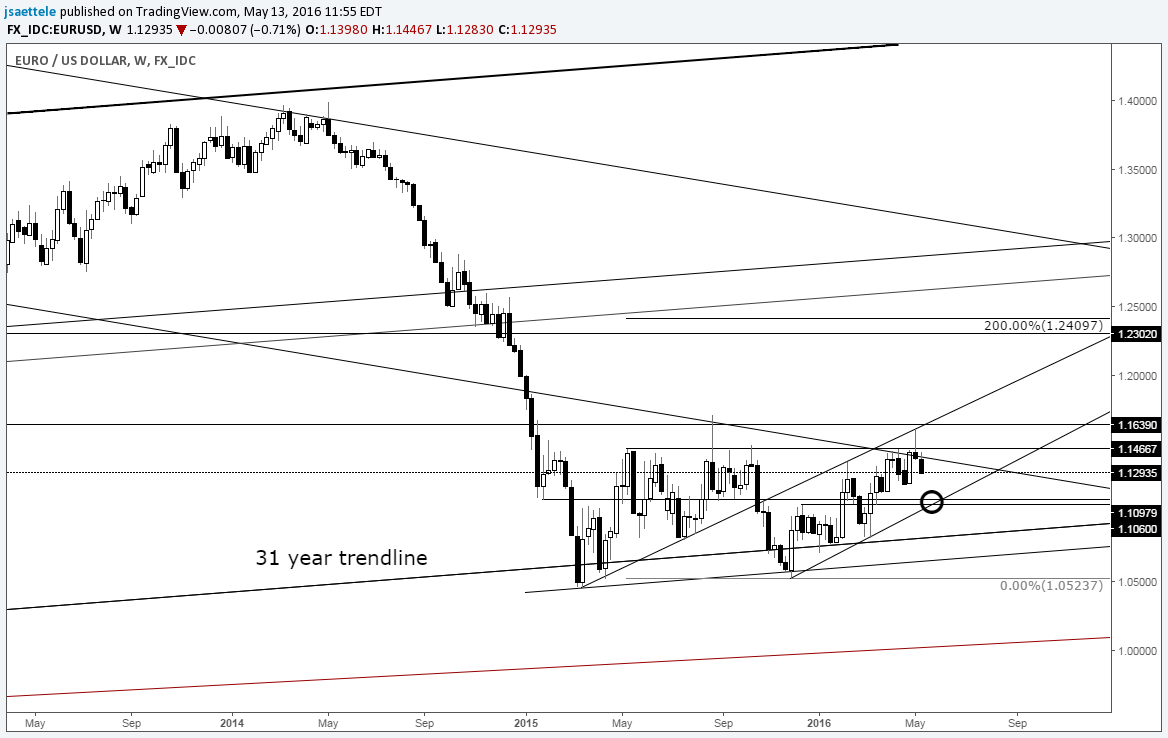
Chart Prepared by Jamie Saettele, CMT
See REAL TIME trader positioning
-FXTW wrote last week that “EUR/USD broke through (resistance) on an intraweek basis but finished the week with a long upper wick that warns of a ‘bull trap’. It seems right to be (long term) bullish given the 31 year trendline support but the breakout may have to wait a bit. As always, define your risk points (read more about traits of successful traders here).” EUR/USD followed through on last week’s reversal. Bulls are probably ‘trapped’ until the mid-1.1000s.
-For forecasts and 2016 opportunities, check out the DailyFX Trading Guides.
GBP/USD
Weekly
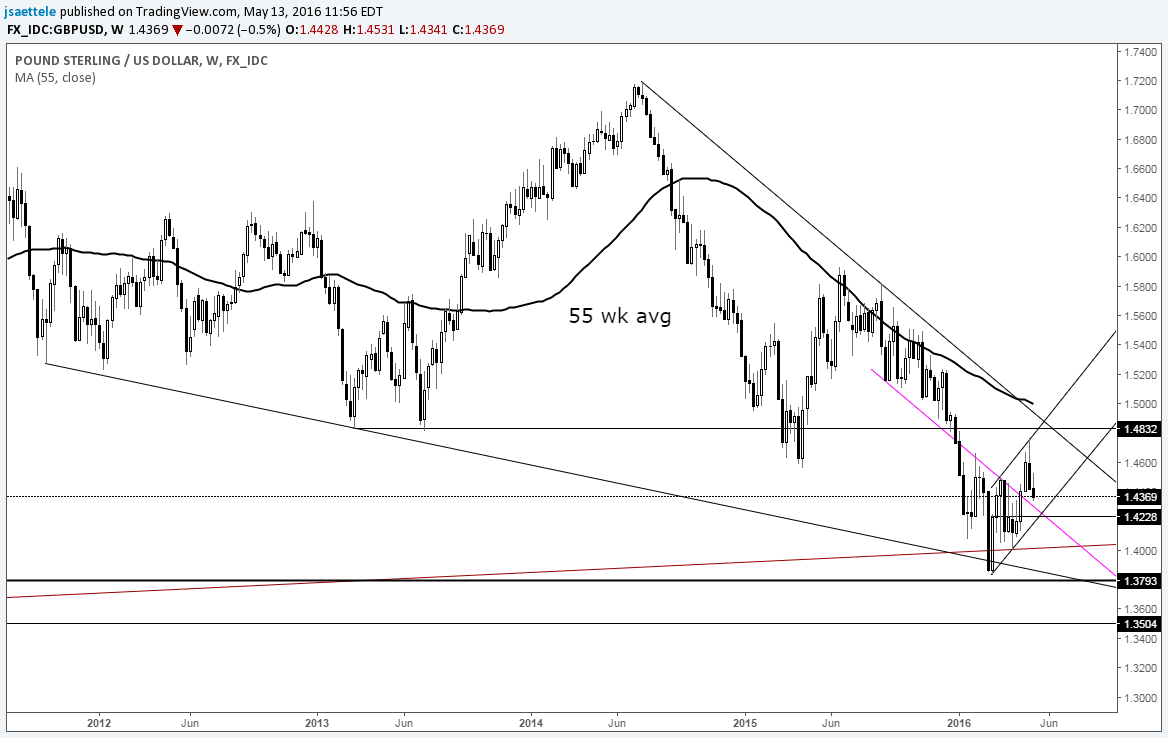
Chart Prepared by Jamie Saettele, CMT
See REAL TIME trader positioning
-Cable carved a key reversal last week. Trade remains constructive for a run at trendline resistance (now mid-1.4900s) but watch for support at the internal trendline that crosses through inflection points since September. FXTW would like to see support register at that line in order to maintain a constructive view. Remember, there is a 96 month (8 year) cycle low count.
Monthly
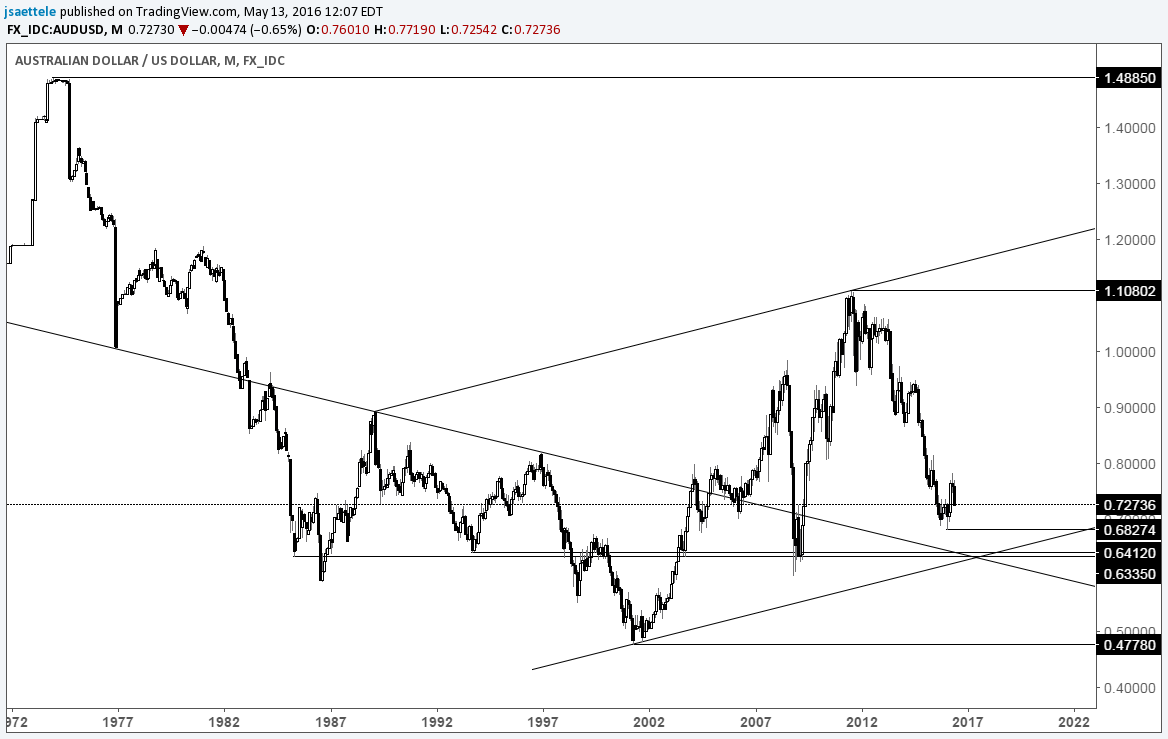
Chart Prepared by Jamie Saettele, CMT
See REAL TIME trader positioning
-FXTW maintained throughout April that “risk of a top is heightened given COT considerations. The combination of resistance, COT (overheated), and the longer term cycle analysis (1 week off) indicates renewed downside potential.” AUD/USD has certainly responded. Allowing for gyrations between .7100-.7200 (support within the range) and .7500 (resistance within the range), trend lows over the summer may need to register before the major low is in place.
Weekly

Chart Prepared by Jamie Saettele, CMT
See REAL TIME trader positioning
-The last update noted that “NZD/USD has ‘faked out’ FXTW for about the last 2 months. In any case, NZD/USD is pressing against an important technical level marked by former support (former downtrend support) and ‘new’ uptrend resistance (channel). If NZD/USD is going lower, it needs to do so now.” Kiwi realized its largest 1 week drop since January last week but was little changed this week. Are the fake-outs over? No idea but risk looks lower from here.
Weekly
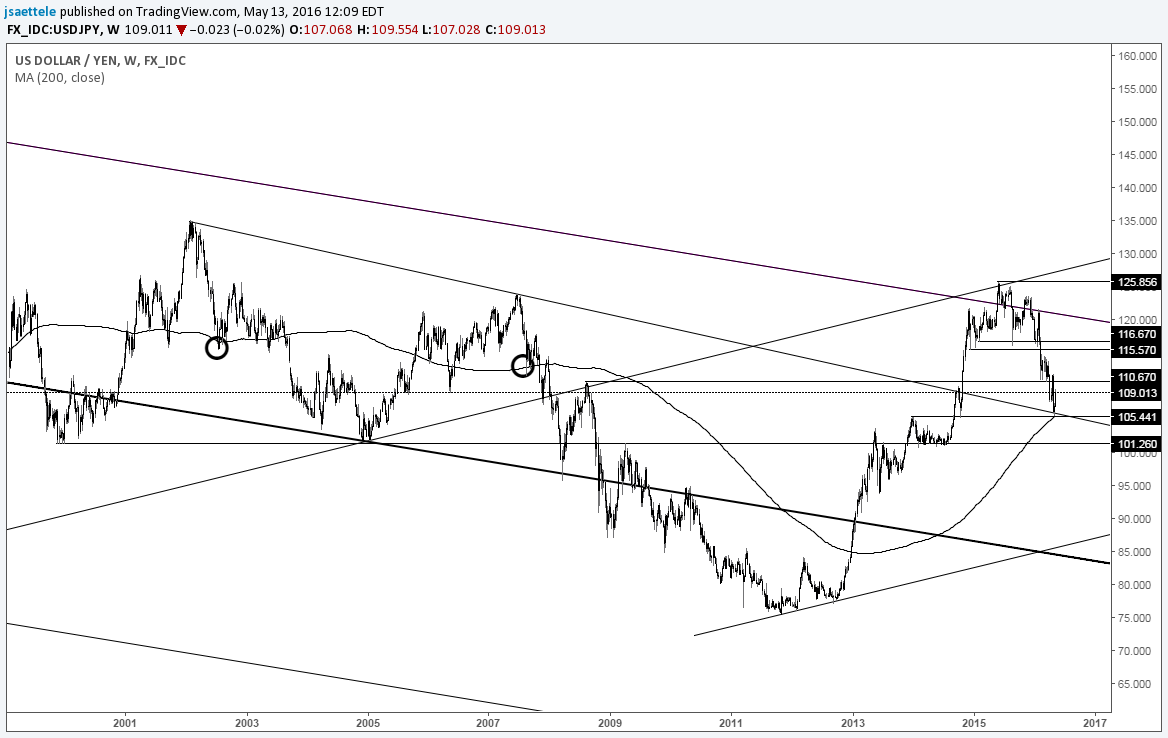
Chart Prepared by Jamie Saettele, CMT
See REAL TIME trader positioning
-There are a host of technical considerations for USD/JPY support between roughly 105 and 106, including the 2002-2007 line, January 2014 high, October 2014 low, and 200 week average. USD/JPY has responded to the top side of the 2002-2007 line and the recent low is 11 ticks above the January 2014 high. Another attempt at the downside is obviously a possibility but the fact remains that USD/JPY is at a key long term juncture.
Weekly

Chart Prepared by Jamie Saettele, CMT
See REAL TIME trader positioning
-There is no change to the weekly USD/CAD analysis. “FXTW views 1.2830 as a pivot. 1.2830 is both the March 2015 high and October 2015 low. Strength through 1.2830 would signal that at least a near term low is in or a near term bottoming pattern is forming…USD/CAD has carved a bullish engulfing candle at major support. The low just made could be significant.”
Weekly

Chart Prepared by Jamie Saettele, CMT
See REAL TIME trader positioning
-USD/CHF followed through on last week’s key reversal. The low is right at a 5 year trendline. In fact, this trendline crosses the lows from May 2014 and May 2015. As noted over at the daily section, “this week’s low is about as far as USD/CHF can go if price action from the November high is a wedge. Failure to hold here would risk weakness to the May 2015 low near .9070. Exceeding wedge resistance (currently mid-.9800s) would bolster bullish prospects.”
-Some extremely long term technical considerations are worthy of note when looking at USD/CHF. Read about them here.”
FXI (Large Cap China)
Hourly

Chart Prepared by Jamie Saettele, CMT
I last wrote about FXI (China) in April (see here). At the time, it was noted that former long term support had become resistance and the prognosis for Chinese equities was bearish. FXI stretched to a final high on 4/19 and is down nearly 12% from that peak. 5 waves down from the 4/19 high indicate potential for a countertrend rally to develop from nearby. Equality between waves 5 and 1 in a sequence is not uncommon and that relationship exists at 30.96 (spot is 31.11 as I type). Any strength is still viewed in a bearish context given both the impulsive weakness from the 4/19 high and 7 wave (corrective) rally from the February low.
FXI
Weekly

Chart Prepared by Jamie Saettele, CMT


