


- EUR/USD and USD/CHF outside weeks
- AUD/USD cycle inversion?
- USD/CAD support from here (1.2830) to 1.2560
-- Subscribe to Jamie Saettele's distribution list in order to receive a free report to your inbox several times a week.
--For more analysis and trade setups (including current positions and the ‘watchlist’), visit SB Trade Desk
--Free trading tips
Weekly
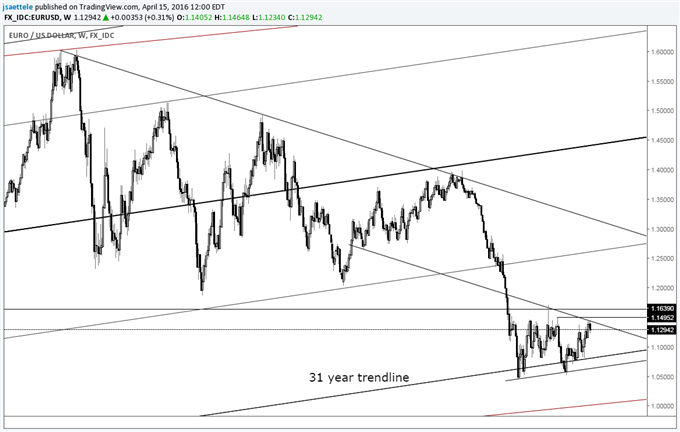
Chart Prepared by Jamie Saettele, CMT
See REAL TIME trader positioning
-The importance of the current juncture in EUR/USD cannot be understated. If resistance from a parallel (August high) and horizontal levels gives way, then EUR/USD could trade to the mid-1.20s, and maybe quickly given that the rate had held a 3+ decade trendline for over a year. The key word in that sentence is ‘if’. A bearish outside week just formed at the combination of parallel and horizontal resistance so respect potential for renewed weakness.
-For forecasts and 2016 opportunities, check out the DailyFX Trading Guides.
Weekly
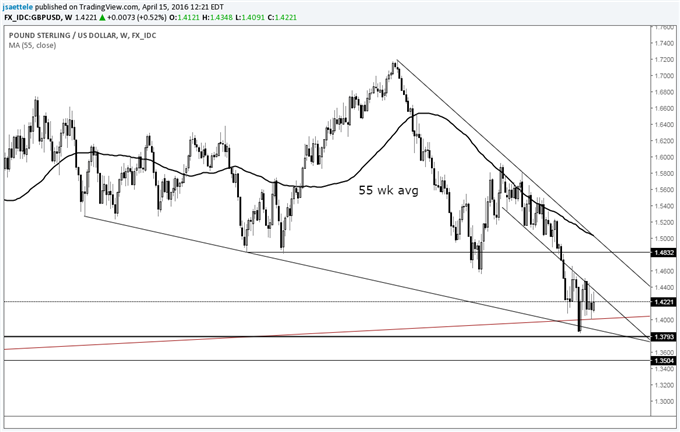
Chart Prepared by Jamie Saettele, CMT
See REAL TIME trader positioning
-There is no change to weekly GBP/USD comments. “Recent price action formed a ‘tweezer bottom’ candlestick formation (FXTW pointed out tweezer bottoms in AUD/USD at the September and January lows). This is a reversal pattern. The fact that the pattern formed amid the chaos of headlines (sentiment extreme on ‘BREXIT’) and at a confluence of trendlines indicates increased risk for a decent sized bounce. General focus is higher, probably until the low 1.50s, although continued failure at an internal trendline is a concern. A crash could then take place into early 2017, based on a 96 month (8 year) cycle low count.”
AUD/USD
Weekly
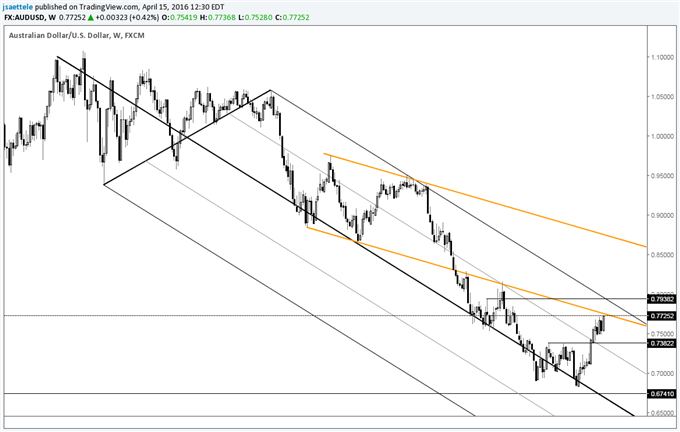
Chart Prepared by Jamie Saettele, CMT
See REAL TIME trader positioning
-AUD/USD is nearing the October 2013-January 2014 line near .7800. Also, risk of a top is heightened given COT considerations. It remains to be seen whether or not the cycle week that I first presented over a month ago has any influence. Inversion is a possibility. If resistance at .7800 breaks, then the next upside level of interest is probably .7938.
-“The 2nd week of April is lining up as a potentially important pivot in time. The 1993 and 2001 lows (latter is the all-time low) are exactly 392 weeks apart. 392 weeks from the 2001 low is the week of the October 2008 crash (the low was 3 weeks later). 392 weeks from the October 2008 crash is the week of April 11th. My colleague Kristian Kerr, whose cycle work is a must read, often stresses the importance of what a market is doing into a time window. In other words, a high/low could form if the market is heading into resistance/support within the window (and if other conditions are met of course). Also, a break of a key level during this time would warn of possible acceleration in the same direction. Context is key (always is). For now, just know that the week of April 11th is a big point on the X-Axis for Aussie.”
Weekly
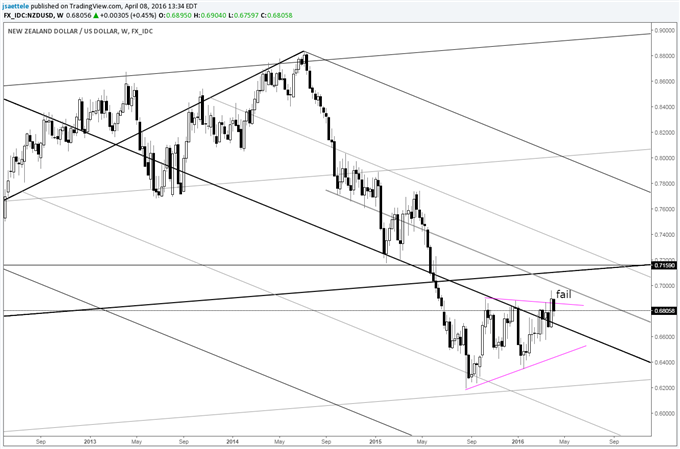
Chart Prepared by Jamie Saettele, CMT
See REAL TIME trader positioning
-There is no change to recent NZD/USD comments. “NZD/USD is attempting to break out from a 7 month ascending triangle pattern. The objective from the pattern is mid .7400s although FXTW believes that .71-.72 (2011 low and February 2015 low) is important and could influence for another leg lower. It’s possible that a failed pattern ends up triggering another bear leg.
Weekly
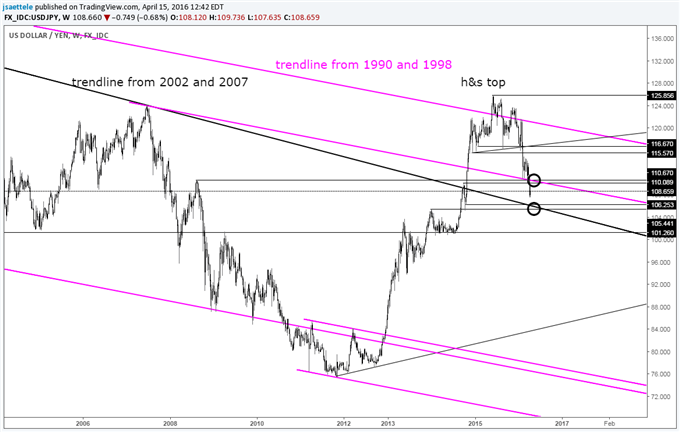
Chart Prepared by Jamie Saettele, CMT
See REAL TIME trader positioning
-There are a host of technical considerations for USD/JPY support between roughly 105 and 106, including the 2002-2007 line, January 2014 high, October 2014 low, and 200 week average. Former support at 110.60 is estimated resistance and strength through that level is needed in order to suggest that a low of some sort is in place.
USD/CAD
Weekly
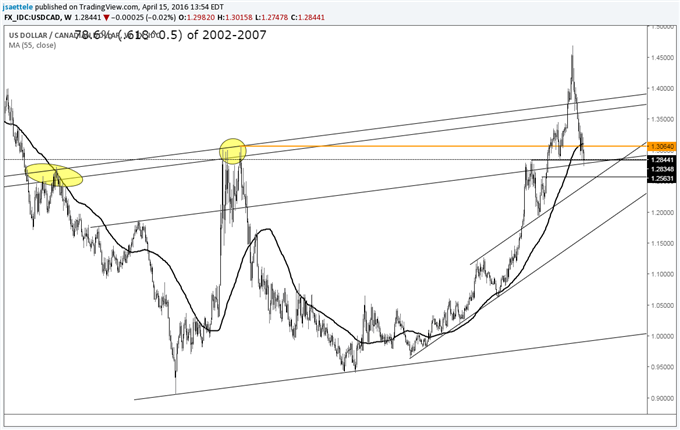
Chart Prepared by Jamie Saettele, CMT
See REAL TIME trader positioning
-USD/CAD continues to break down. The rate is finishing the week near 1.2830, which is both the March 2015 high and October 2015 low. This is support but failure to turn up here risks a drop into the June 2015 high of 1.2563. FXTW believes that USD/CAD will trade back into 1.38 this year before turning down again but development of a near term base is required in order to trade from the long side.
USD/CHF
Weekly
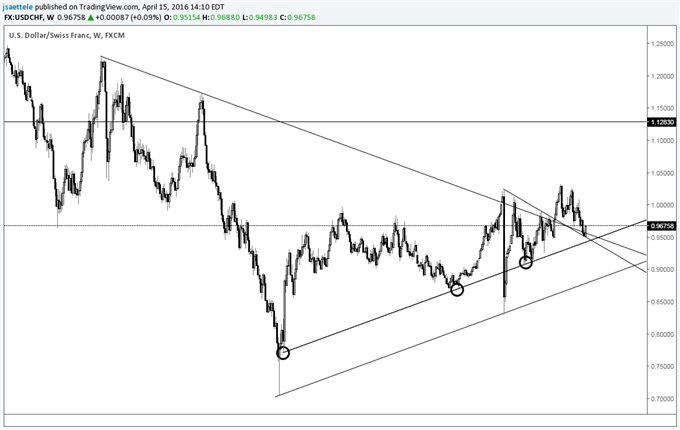
Chart Prepared by Jamie Saettele, CMT
See REAL TIME trader positioning
-USD/CHF made a bullish outside week at the top side of former trendline resistance lines (long and short term). Given long term considerations, this week’s low could be significant. “Some extremely long term technical considerations are worthy of note when looking at USD/CHF. Read about them here.”


