


-- Subscribe to Jamie Saettele's distribution list in order to receive a free report to your inbox several times a week.
--For more analysis and trade setups (including current positions and the ‘watchlist’), visit SB Trade Desk
--Free trading tips
Weekly

Chart Prepared by Jamie Saettele, CMT
See REAL TIME trader positioning
-The most recent comments noted that “the failed breakout could be bearish but EUR/USD is still in a range (could end up as a triangle or flat from the 2015 low) and levels to pay attention to for support are 1.0872 (year open) and 1.0820 (May and July 2015 lows)…a break above 1.1500 would argue for the flat pattern interpretation into the mid-1.20s.” The low 3 weeks ago was 1.0820, which is also the trendline that extends off of the 1985 and 2000 low. 1.1500 remains range resistance. A break above would set an objective near 1.25.
-For forecasts and 2016 opportunities, check out the DailyFX Trading Guides.
GBP/USD
Monthly
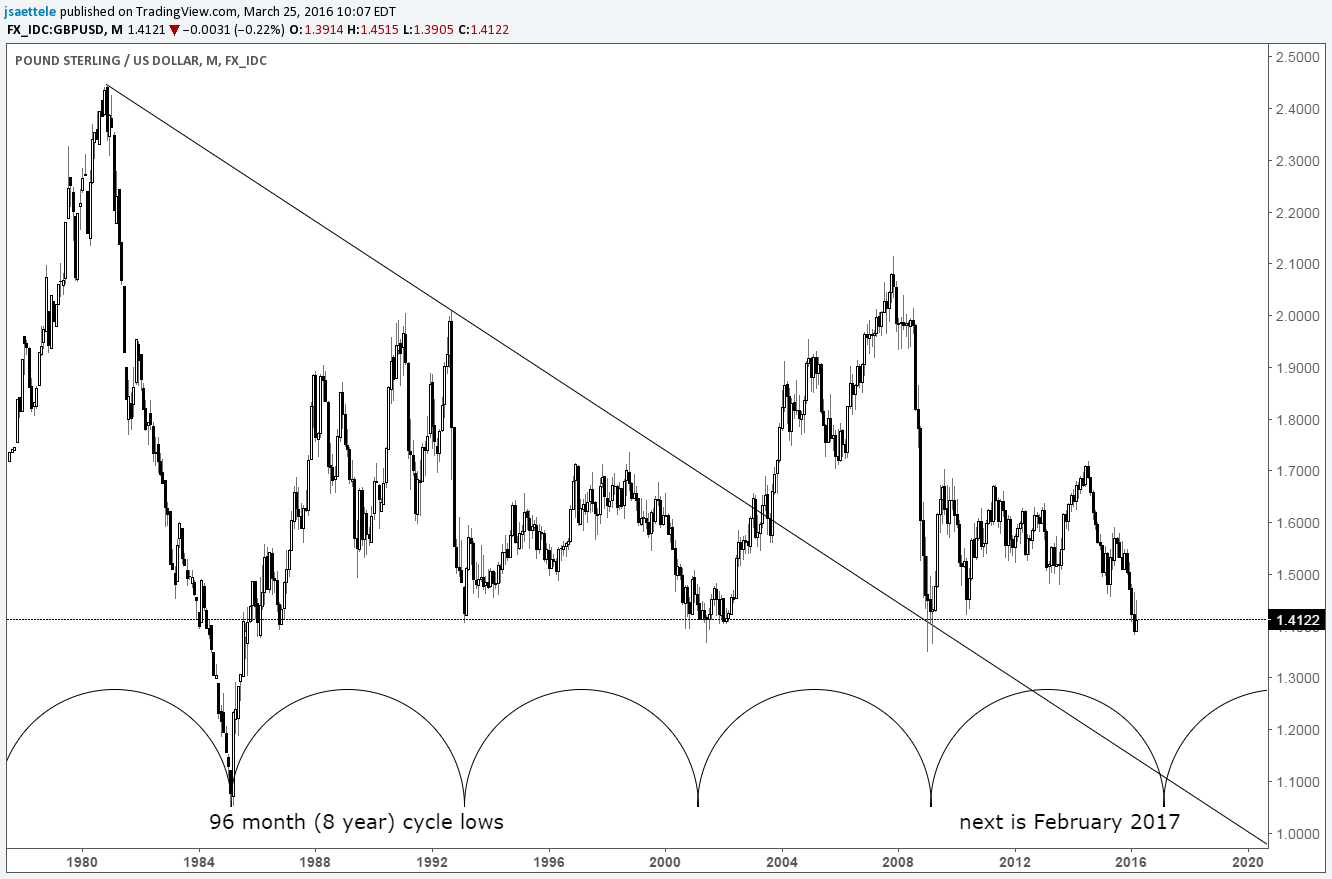
Chart Prepared by Jamie Saettele, CMT
See REAL TIME trader positioning
-Recent price action formed a ‘tweezer bottom’ candlestick formation (FXTW pointed out tweezer bottoms in AUD/USD at the September and January lows). This is a reversal pattern. The fact that the pattern formed amid the chaos of headlines (sentiment extreme on ‘BREXIT’) and at a confluence of trendlines indicates increased risk for a decent sized bounce. General focus is higher, probably until the low 1.50s. A crash could then take place into early 2017, based on a 96 month (8 year) cycle low count.
AUD/USD
Weekly
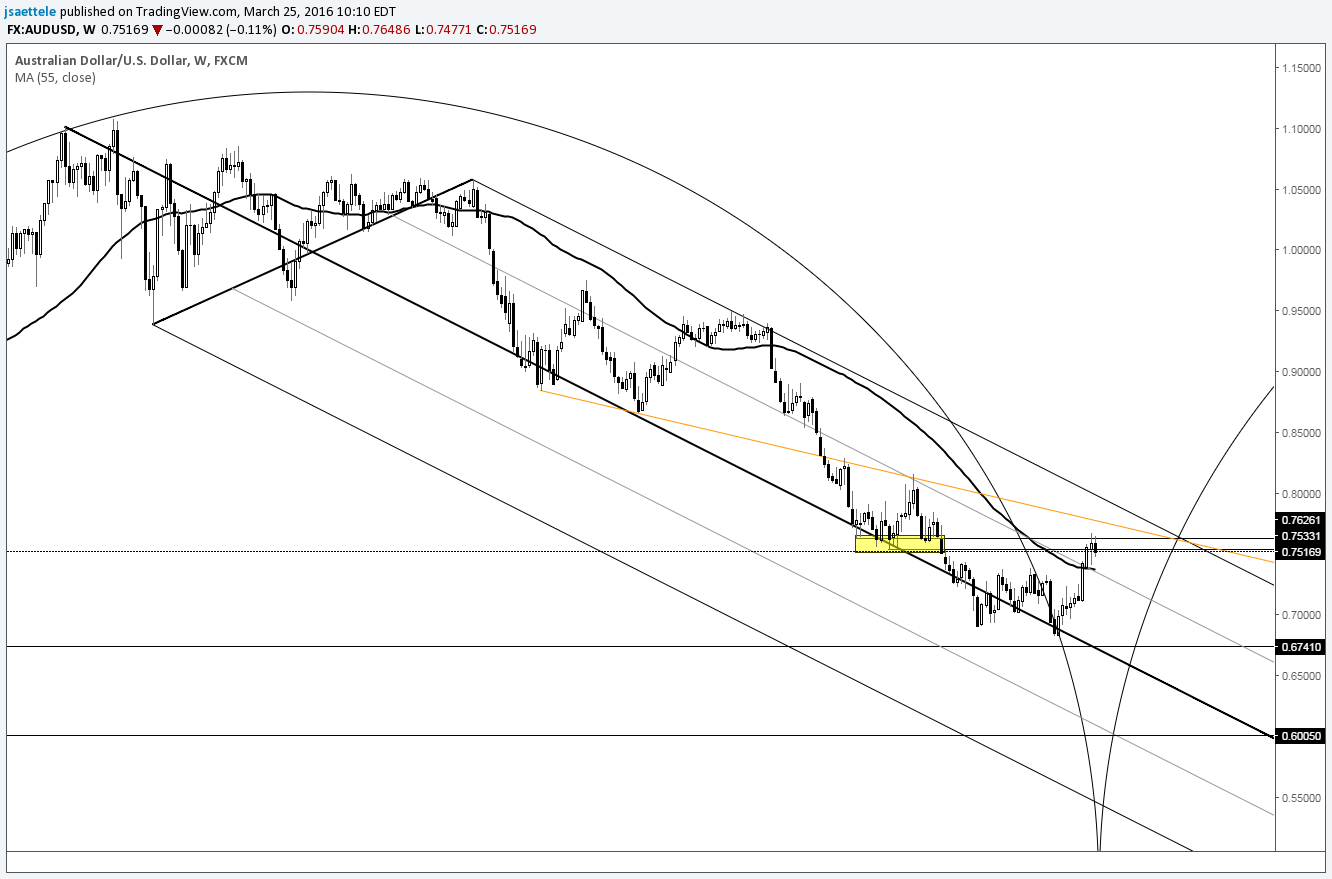
Chart Prepared by Jamie Saettele, CMT
See REAL TIME trader positioning
-There is no change to recent AUD/USD comments. “FXTW has maintained since the start of 2016 that “divergence with RSI on the weekly serves as a bullish reversal warning and that resistance may reside in the mid .7400s.” AUD/USD has pressed into the congestion zone that dominated 2015 so near term trade may take on a more ‘choppy’ tone. Irrespective, focus is higher as per the break above the October and December highs.”
-“The 2nd week of April is lining up as a potentially important pivot in time. The 1993 and 2001 lows (latter is the all-time low) are exactly 392 weeks apart. 392 weeks from the 2001 low is the week of the October 2008 crash (the low was 3 weeks later). 392 weeks from the October 2008 crash is the week of April 11th. My colleague Kristian Kerr, whose cycle work is a must read, often stresses the importance of what a market is doing into a time window. In other words, a high/low could form if the market is heading into resistance/support within the window (and if other conditions are met of course). Also, a break of a key level during this time would warn of possible acceleration in the same direction. Context is key (always is). For now, just know that the week of April 11th is a big point on the X-Axis for Aussie.”
Weekly
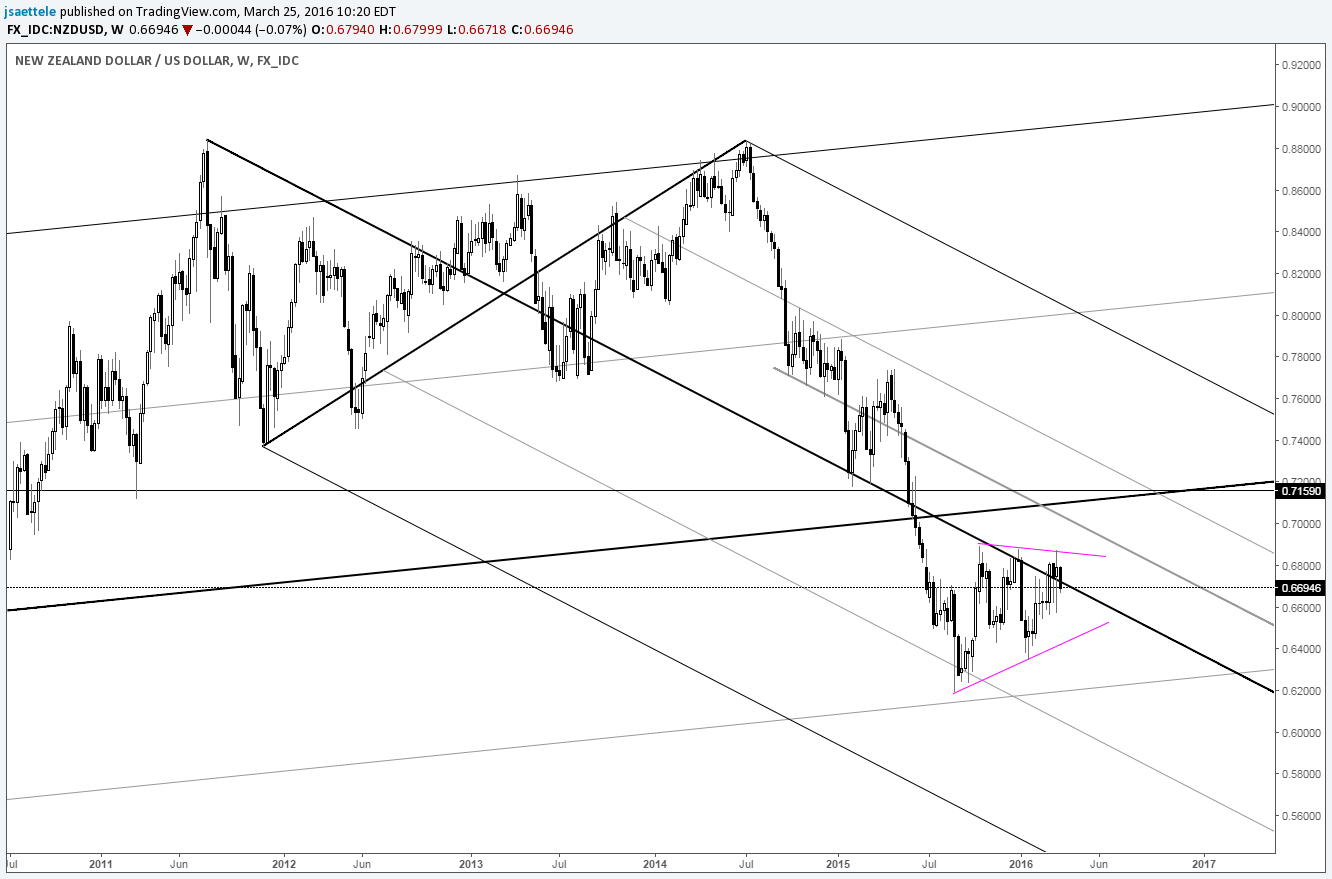
Chart Prepared by Jamie Saettele, CMT
See REAL TIME trader positioning
-FXTW remains conflicted on NZD/USD at the moment and there are no new comments. “Failures shy of the long term median line throughout February were viewed in a bearish light until last week’s outside bullish action lent near term action a more constructive look. The constructive look is maintained as long as above .6565.”
USD/JPY
Weekly

Chart Prepared by Jamie Saettele, CMT
See REAL TIME trader positioning
-There is no change to weekly USD/JPY comments. “The head and shoulders target is still in focus near 105, which is near the January 2014 high and October 2014 low, but it could be a while before that is reached. Don’t overlook the fact that this week’s low is 110.66…or 1 pip from the 2008 high. A parallel to the 1990-1998 line, extended from the 2007 high, is also at the low (this angle was also the neckline from the 2010-2012 inverse head and shoulders that launched the rally into last summer. Generally speaking, USD/JPY could hold up for a while longer.”
Weekly

Chart Prepared by Jamie Saettele, CMT
See REAL TIME trader positioning
-FXTW wrote last week that “USD/CAD 1.30 has been reached so it may be time to go the other way. Weekly RSI has reached 40 as well, which is often associated with at least near term markets lows.” The turn higher this week was in line with expectations. FXTW believes that the broader bull trend has resumed but be aware of 1.3816 as a trading level.
Weekly
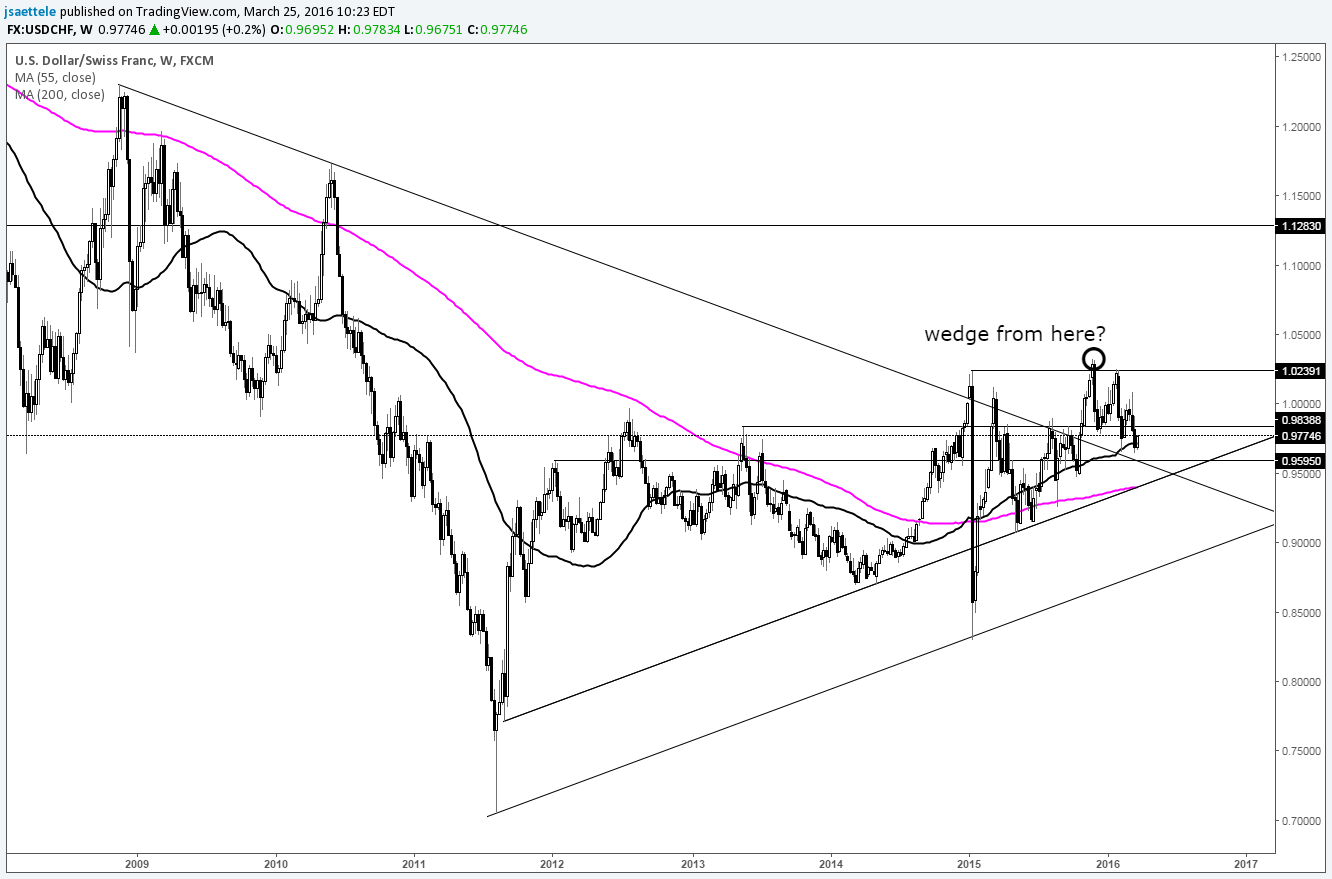
Chart Prepared by Jamie Saettele, CMT
See REAL TIME trader positioning
-USD/CHF is consolidating (perhaps in a wedge from the November high) and there is nothing else to add to previous comments regarding the longer term picture at this time. “Some extremely long term technical considerations are worthy of note when looking at USD/CHF. Read about them here. Levels for possible support on this decline are .9595 (trendline and January 2012 high) and just below .9400 (trendline and 200 week average).”
Bonus Chart
Dow Jones Industrials Monthly
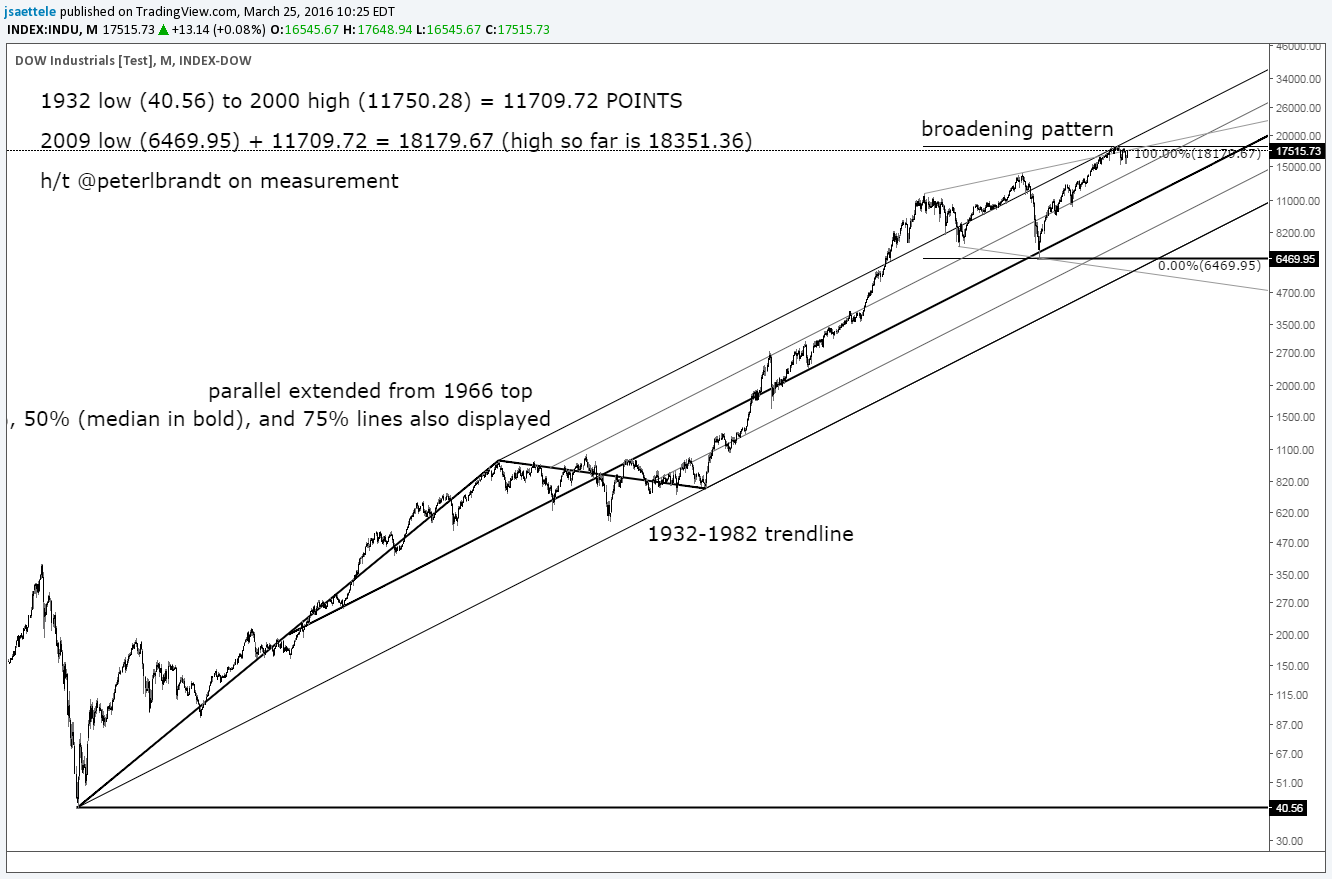
Chart Prepared by Jamie Saettele, CMT
-The above chart and comments were produced as part of the Q2 forecasts, which should be published later today. When beginning an analysis for indices, it’s wise to have a handle on the long term picture. This monthly chart of the Dow Jones Industrials is close to as long term as it gets! Basically, the ‘angle of influence’ on a long term basis is the line that connects the 1932 and 1982 lows. A parallel extended from the 1966 top creates a channel. That upper channel line has come into play as support and resistance over the last 16 years. In fact, the line was precise support in September 2001, and then support throughout 2004 and 2006 as global equities ascended into their 2007 tops. The financial crisis low registered at the center line (also known as median line) of this channel. The aforementioned upper channel line was touched again in November 2014. The index traded around this line until June 2015. In other words, former support (in 2001 and 2004 to 2006) has become resistance (2014-2015). The dynamic is long term bearish but the index can still rally to a new high. The same line will be of interest for resistance again. So, we view the indices over the next quarter and longer with the understanding that the long term reward/risk situation is generally unfavorable. Also, it is interesting to note that the rally (in points, but it’s simply an observation) from 1932 to 2000 is equal to the 2009-2015 rally.


