


- GBP/USD downtrend resumption from trendline confluence
- AUD/USD follows through on weekly tweezer bottom
- USD/JPY rips but still below long term trendline
-- Subscribe to Jamie Saettele's distribution list in order to receive a free report to your inbox several times a week.
--For more analysis and trade setups (including current positions and the ‘watchlist’), visit SB Trade Desk
Weekly
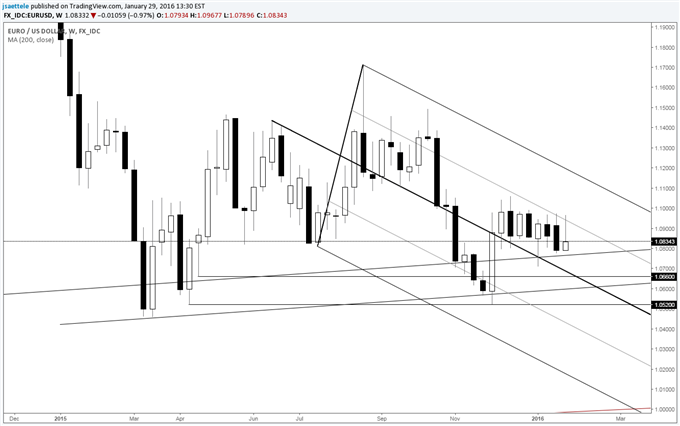
Chart Prepared by Jamie Saettele, CMT
Automate trades with Mirror Trader
-Long term comments remain valid – “EUR/USD has been holding its long term trendline support since March 2015 (even the January low is right on the line). November and December trade produced a tweezer bottom (reversal candlestick pattern…bullish in this case) as well. 2 scenarios seem most likely from the current juncture; a continued range (with roughly 1.15 resistance) or a bullish base that leads to an eventual breakout into the 1.20s.”
-Near term, FXTW suggests watching for support on the shorter term median line (bold black line on the chart above) in the mid-1.0600s. The market has been in a tight range since December (in fact, this is the tightest 8 week range since August 2015, when a major breakdown began). Such conditions aren’t conducive to SSI breakout strategies. However, ranges precede directional moves so pay attention to key technical breaks.
-For forecasts and 2016 opportunities, check out the DailyFX Trading Guides.
GBP/USD
Weekly
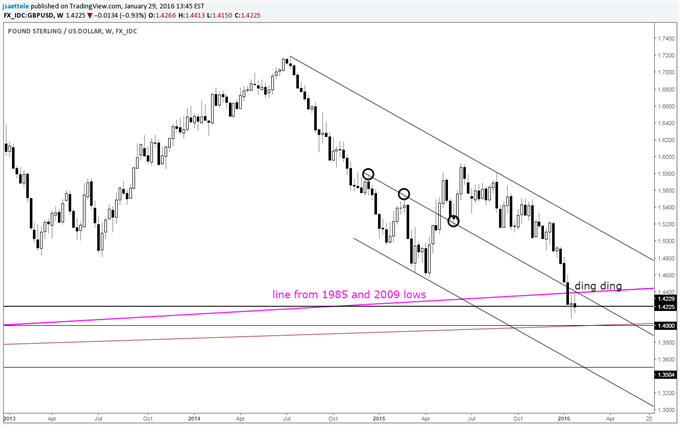
Chart Prepared by Jamie Saettele, CMT
Automate trades with Mirror Trader
-FXTW wrote last week that “cable bounced higher this week but price needs to establish above 1.4400 (see trendline confluence on the chart) in order to suggest that even a short term low is in place.” The underside of the 1985 and 2009 line (which broke 2 weeks ago) and an internal trendline provided precise resistance for downside continuation. The next area of interest on the downside is around 1.40.
AUD/USD
Weekly
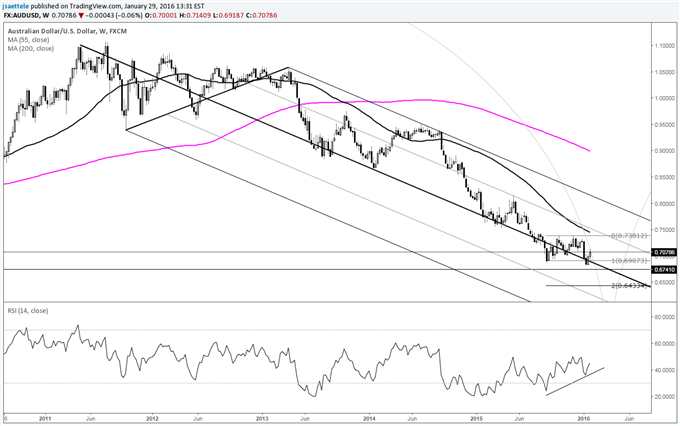
Chart Prepared by Jamie Saettele, CMT
Automate trades with Mirror Trader
-FXTW wrote last week that “corrective (range bound) trading behavior may very well continue given this week’s tweezer bottom (at the long term median line no less). Divergence with RSI on the weekly serves as a bullish reversal warning too.” AUD/USD followed through on the tweezer bottom this week and the short term charts ‘look’ constructive. If the USDOLLAR is grinding into some sort of top (see a video on this here), then AUD/USD may be the play.
Weekly
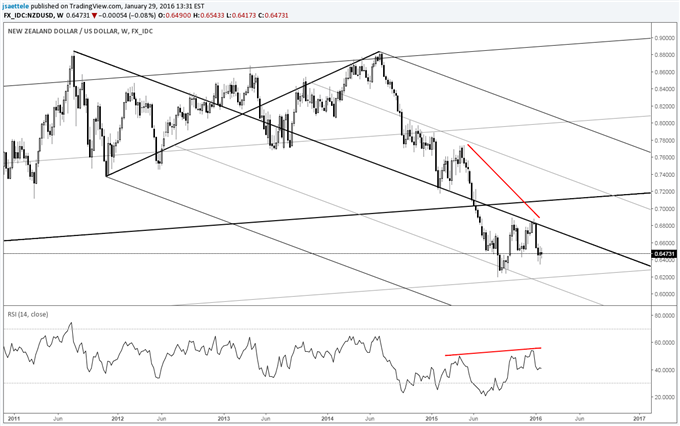
Chart Prepared by Jamie Saettele, CMT
Automate trades with Mirror Trader
-NZD/USD was quiet this week and there is no change to prior comments. “The October and December highs create a double top within the longer term downtrend. The red lines on the chart indicate a long term RSI trend sell signal (higher RSI and lower price). The October high remains critical to any bearish interpretation. Like AUD/USD, a period of range trading may be in store given the recovery from under the November low.”
USD/JPY
Monthly
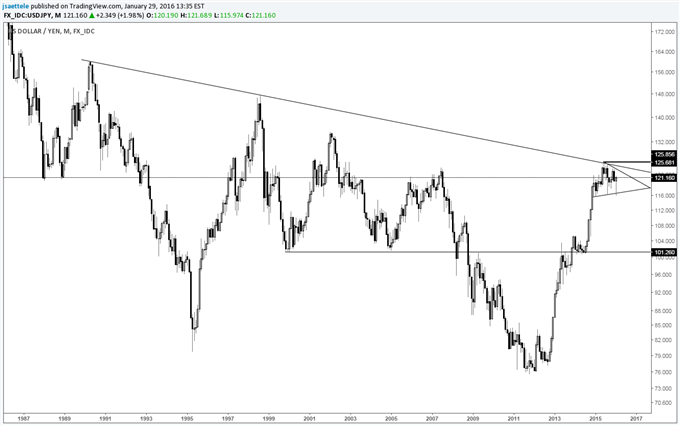
Chart Prepared by Jamie Saettele, CMT
Automate trades with Mirror Trader
-FXTW has been following a possible head and shoulders top that started forming in December 2015. Last week’s reversal materialized from the neckline of that pattern. This week’s follow through has resulted in a test of the 55 week average. The 2015 high was right at the 1990-1998 line (log scale), so a broader topping formation is still possible.
Monthly
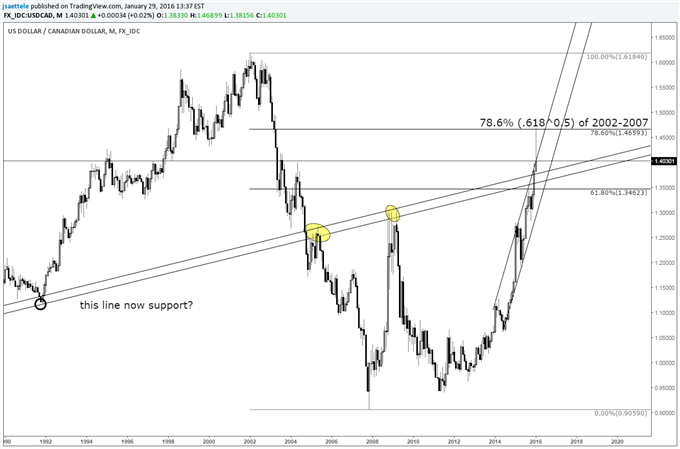
Chart Prepared by Jamie Saettele, CMT
Automate trades with Mirror Trader
-The most recent FXTW comments were that “extremely long term slope analysis reveals that the 1976-1991 line, which was resistance (not precise however), could end up as support again on the next ‘correction’. That line is around 1.3600. If USD/CAD is going to ‘correct’, which might it correct from? At this point, I’d watch the 78.6% retracement of the decline from the 2002-2007 decline. The Fib is 1.4659.” The high this month was 1.4689 and USD/CAD has reversed sharply. A top of some importance could be in place.
Weekly
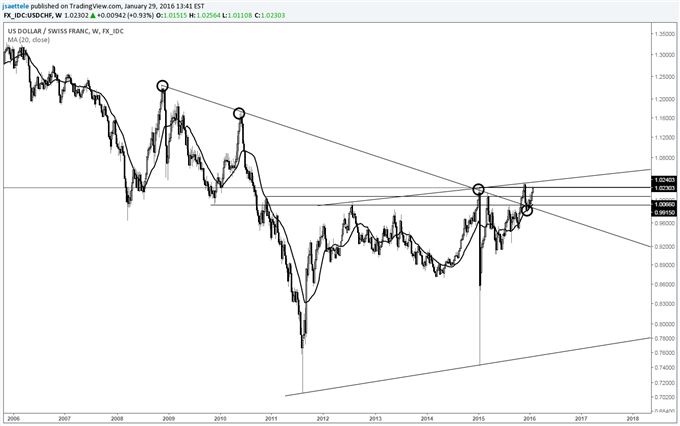
Chart Prepared by Jamie Saettele, CMT
Automate trades with Mirror Trader
-Some extremely long term technical considerations are worthy of note when looking at USD/CHF. Read about them here. This week’s advance brings the cross less than 2 big figures away from multiyear highs so another breakout attempt (first one was in November) may be near.


