


-- Subscribe to Jamie Saettele's distribution list in order to receive a free report to your inbox several times a week.
--For more analysis and trade setups (including current positions and the ‘watchlist’), visit SB Trade Desk
Monthly
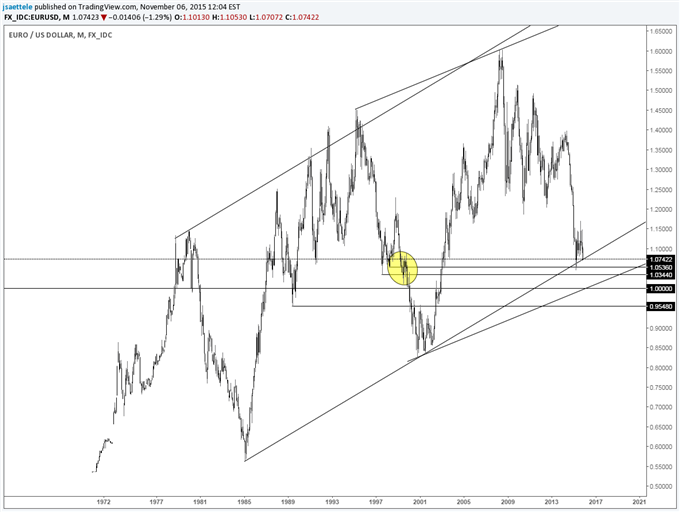
Chart Prepared by Jamie Saettele, CMT
Automate trades with Mirror Trader
-For months, FX Technical Weekly has been steadfast in that “support is estimated in the mid-1.0800s. Resistance is estimated in the mid-1.1400s (May and June high are 1.1435/65). A break on either side would indicate potential for a larger move.” EURUSD cracked the summer lows today thus downside potential may be realized towards parity (parallel with line from 1995-2008 highs).
Weekly
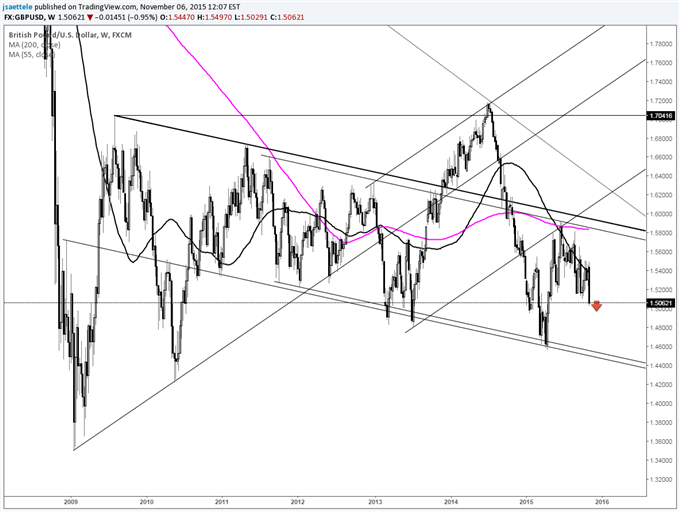
Chart Prepared by Jamie Saettele, CMT
Automate trades with Mirror Trader
-In line with the broader trend, 9 months of sideways trade in GBP/USD has resolved to the downside. Focus is on the lower parallel supports that cross lows over the last several years. In other words, focus is on a new low (below the April low). A break of the downward sloping lower parallels could set off a crash towards the 2009 low.
Weekly
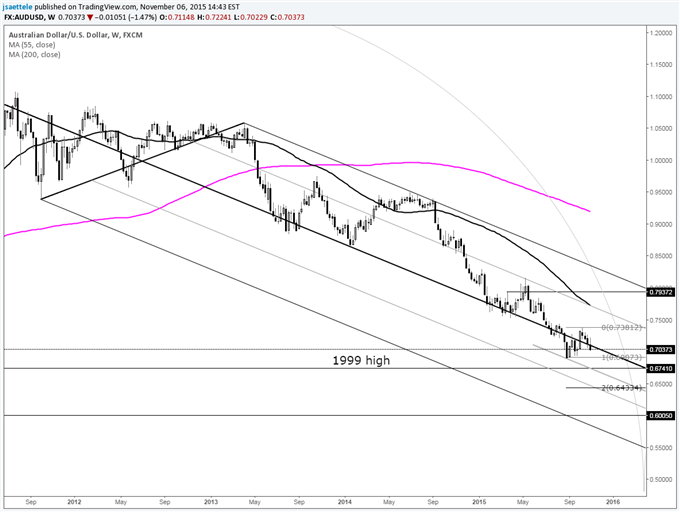
Chart Prepared by Jamie Saettele, CMT
Automate trades with Mirror Trader
-Last week, FXTW mentioned the “long term median line (albeit downward sloping)” and that “countertrend advances have materialized off of this line time and time again so respect potential for something other than another breakdown.” Friday’s move broke a channel on the daily, which negates anything constructive. A level of interest in the event of a new low is .6741 (1999 high). The range expansion objective from a break would be .6433.
Weekly
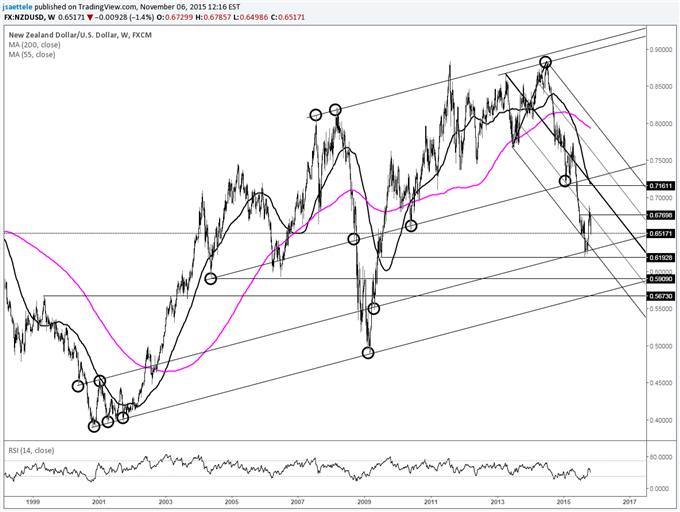
Chart Prepared by Jamie Saettele, CMT
Automate trades with Mirror Trader
-NZD/USD is wedged between a long term resistance line (was support in January) and an even longer term support line. If this long term support gives way, then focus would shift to .5673 (combination of the next parallel and the 1999 high).
USD/JPY
Weekly
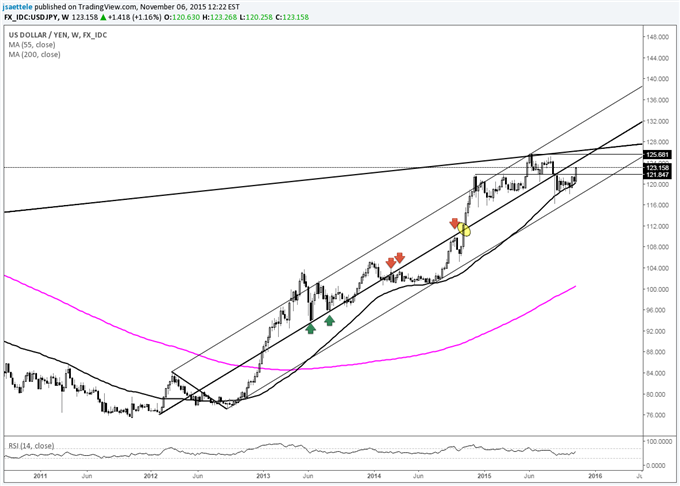
Chart Prepared by Jamie Saettele, CMT
Automate trades with Mirror Trader
-Friday’s move produced a break above an important horizontal level in 121.85. Immediate focus is on the long term upward sloping median line. This line has been support and resistance in the past. The late 2014 (BoJ on Halloween) advance commenced upon a break above this line as well. Point is, the line is a useful reference point…so pay attention!
Weekly
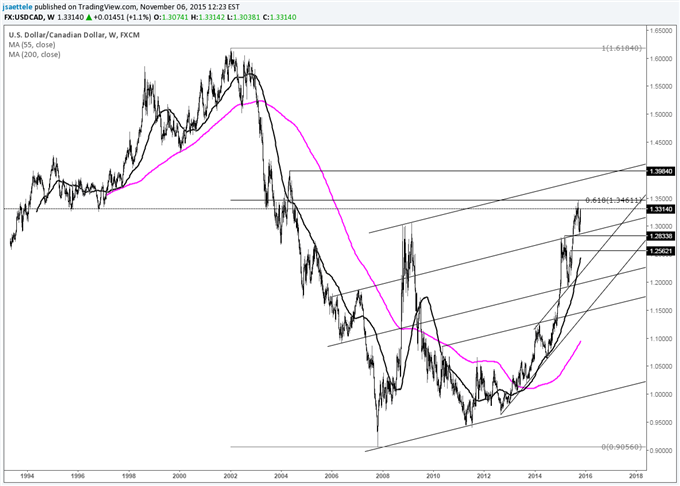
Chart Prepared by Jamie Saettele, CMT
Automate trades with Mirror Trader
-FXTW wrote previously that “USD/CAD has plummeted from several pips shy of the long term Fibonacci retracement at 1.3462 (61.8% retracement of 2002-2007 decline). The current juncture, defined by the March high at 1.2834 and a slope level near 1.2720, could influence for a bounce but the larger trend has changed (it’s down).” The break above last week’s high diminishes confidence in (but doesn’t destroy) the topping ‘idea’. New highs could carry to the next parallel near 1.38 (all-time high is 1.618…).
USD/CHF
Weekly
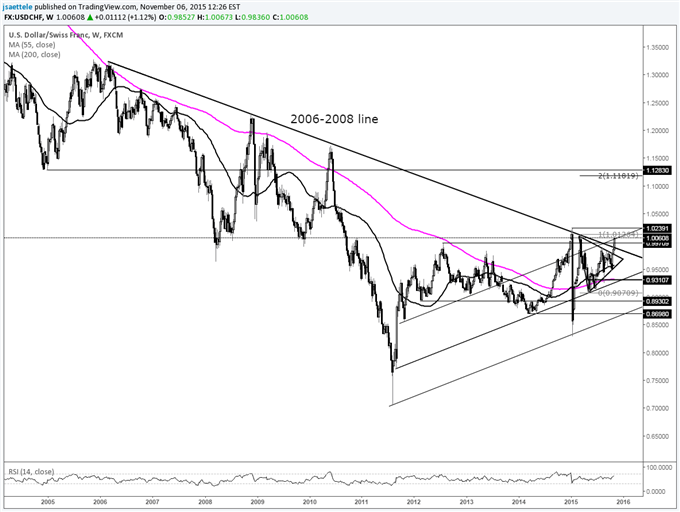
Chart Prepared by Jamie Saettele, CMT
Automate trades with Mirror Trader
-“Alternating and contracting moves since March probably compose a triangle. The implication is that the USD/CHF range tightens some more before the rate attempts an important directional move. Which way? I don’t know but if it’s higher then the 2006-2008 trendline comes into play and a break above there would be significant (as in going to 1.20+).” USD/CHF has broken out of its triangle as well as a 9 year trendline. The breakout objective is 1.1182.


