


-- Subscribe to Jamie Saettele's distribution list in order to receive a free report to your inbox several times a week.
--For more analysis and trade setups (including current positions and the ‘watchlist’), visit SB Trade Desk
Weekly

Chart Prepared by Jamie Saettele, CMT
Automate trades with Mirror Trader
-For months, FX Technical weekly has been steadfast in that “support is estimated in the mid-1.0800s. Resistance is estimated in the mid-1.1400s (May and June high are 1.1435/65). A break on either side would indicate potential for a larger move.” EUR/USD traded 1.1494 (a bit above the cited level) 2 weeks ago and down to 1.0897 this week. This is support near term. Failure to hold here would make a breakdown a reality. It’s decision time.
Weekly
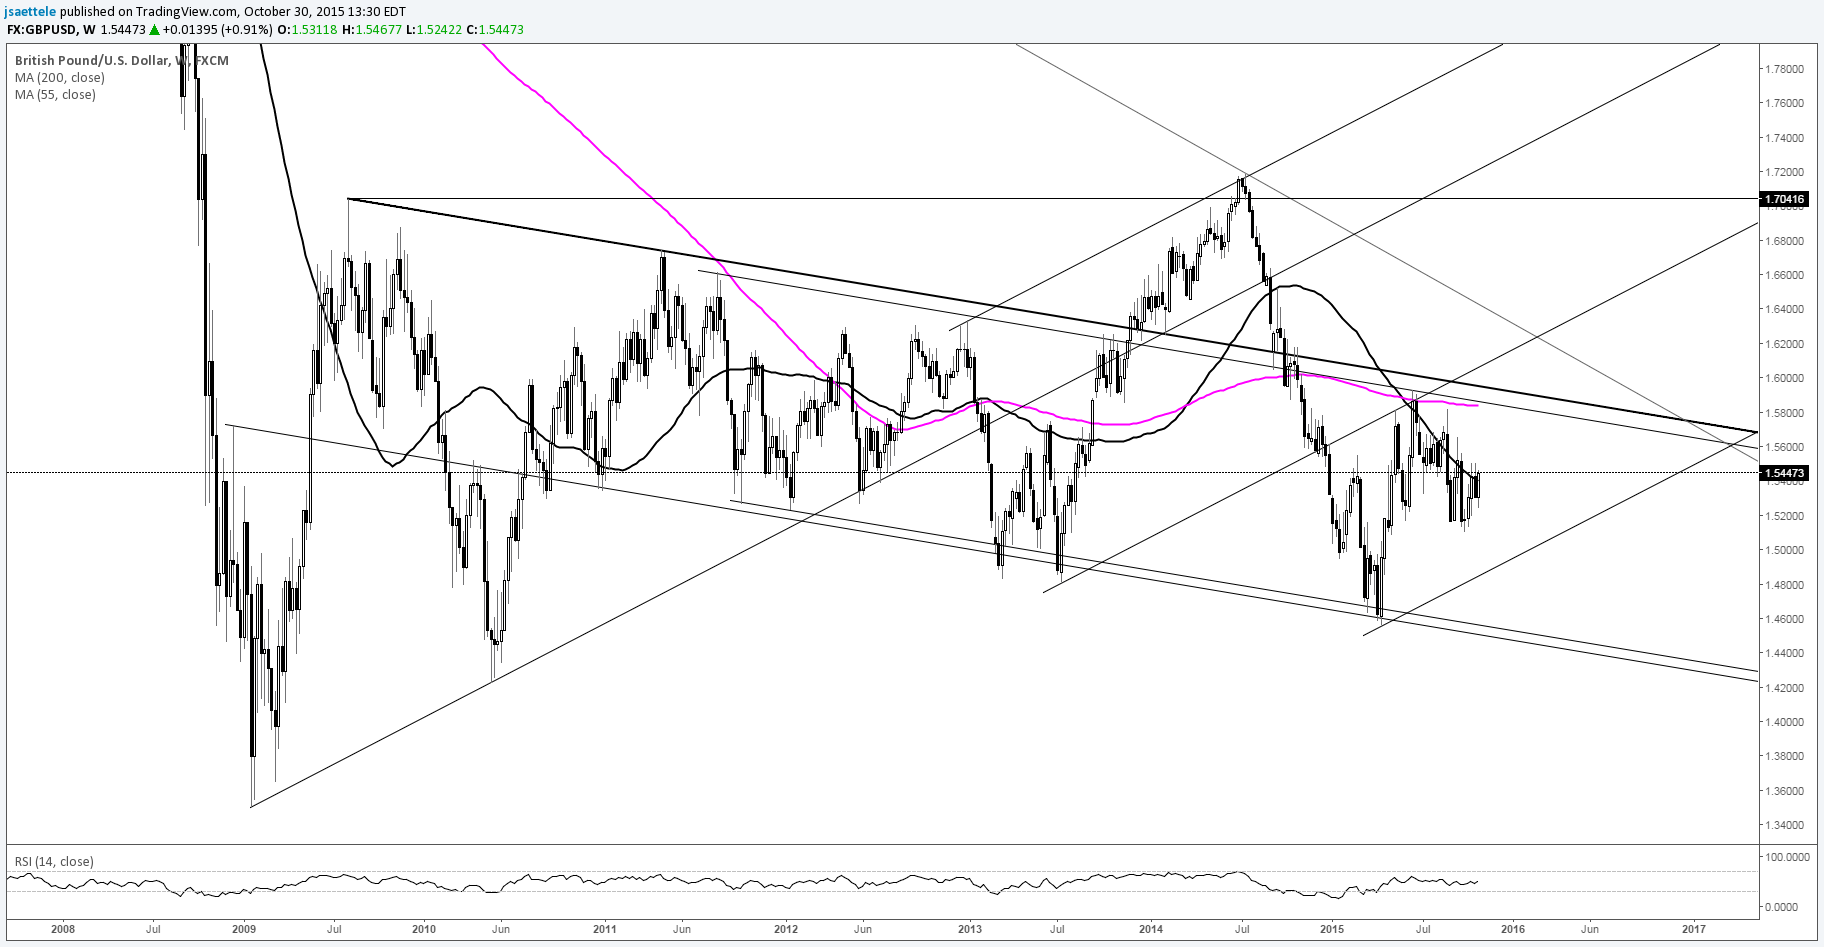
Chart Prepared by Jamie Saettele, CMT
Automate trades with Mirror Trader
-The long term tradable slope in GBP/USD is best described by the line that extends off of the 2009 and 2011 highs and its associated parallels. Right now (10/30) is trading ‘no man’s land’ (not at support and we’re not at resistance) but resistance is 1.5800-1.6000…if it gets there.
Weekly

Chart Prepared by Jamie Saettele, CMT
Automate trades with Mirror Trader
-The AUD/USD rally failed 3 weeks ago (we were looking towards .7530-.7625) but bears aren’t in the clear here either. This week’s low registered at a long term median line (albeit downward sloping). Countertrend advances have materialized off of this line time and time again so respect potential for something other than another breakdown.
NZD/USD
Weekly

Chart Prepared by Jamie Saettele, CMT
Automate trades with Mirror Trader
-NZD/USD continues to act well. After breaking through the August high 2 weeks ago, the rate has put in 2 weeks of consolidation and maintained the breakout level. FXTW maintains that “there probably isn’t solid resistance until near .70. .70 represents channel resistance and the 200 day average.”
USD/JPY
Weekly
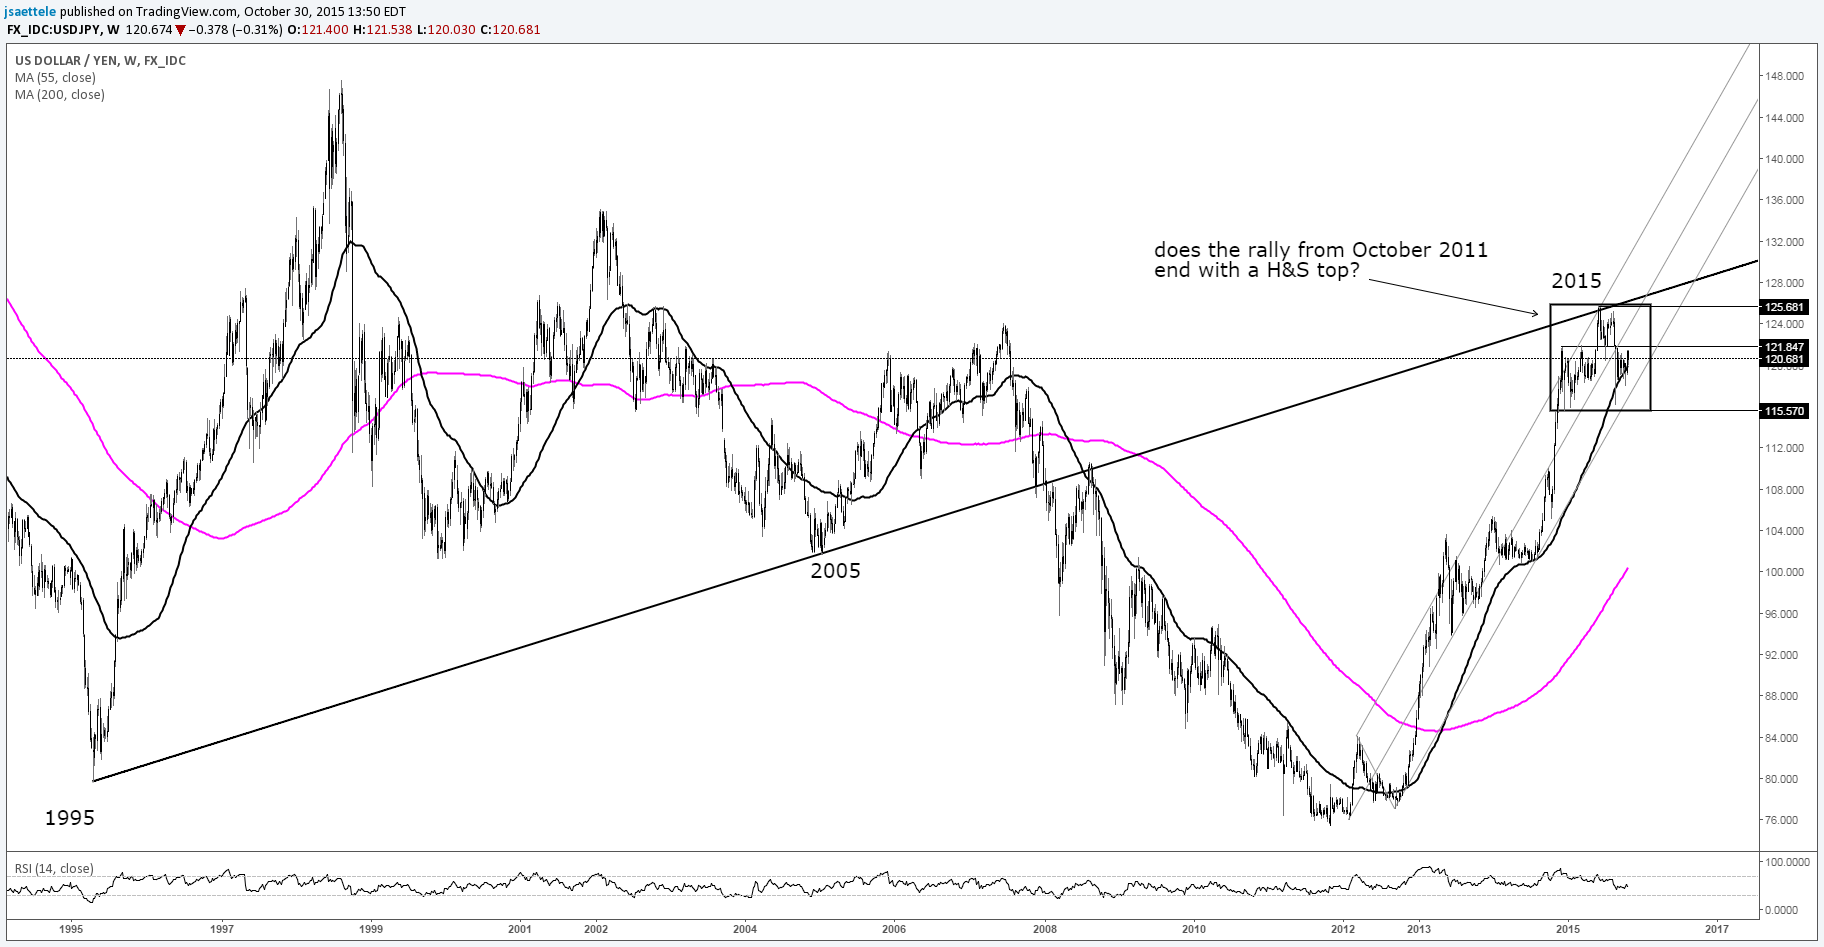
Chart Prepared by Jamie Saettele, CMT
Automate trades with Mirror Trader
-USD/JPY continues to fail in the vicinity of the December 2014 and March 2015 highs. In fact, price action since December 2014 could be forming a giant head and shoulders top. Even if that is the case, sideways action could stretch into February (time of consolidation from Dec 2014 to May = time of consolidation from August 2015 to February 2016).
-Previous comments are still valid; “June’s trade produced a monthly key reversal in USD/JPY. This key reversal didn’t form just anywhere…it formed at the line that connects the 1995 and 2005 lows. That line was support in 2007 and resistance before the 2008 collapse. The time element is interesting of course too (MAJOR turn every 10 years in USDJPY). Bottom line, the key reversal may have signaled a multi-year top in USD/JPY.”
USD/CAD
Weekly
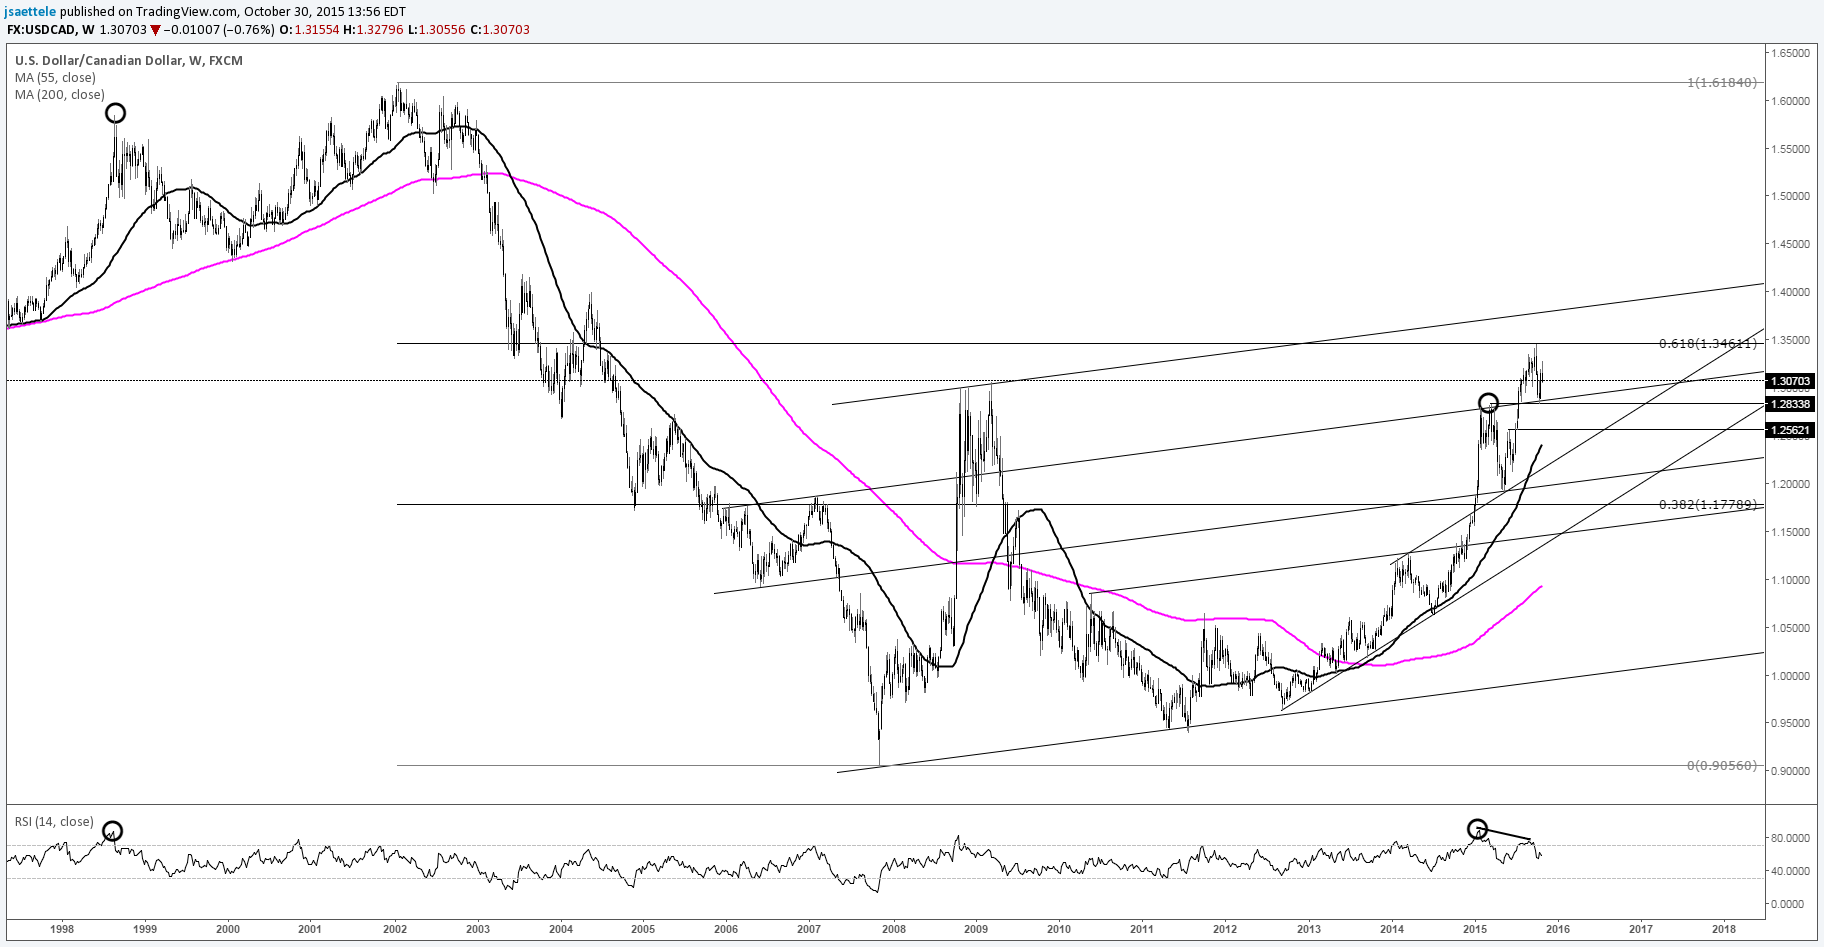
Chart Prepared by Jamie Saettele, CMT
Automate trades with Mirror Trader
-FXTW wrote previously that “USD/CAD has plummeted from several pips shy of the long term Fibonacci retracement at 1.3462 (61.8% retracement of 2002-2007 decline). The current juncture, defined by the March high at 1.2834 and a slope level near 1.2720, could influence for a bounce but the larger trend has changed (it’s down).” This week’s bearish key reversal could signal the beginning of the next leg lower although price does need to crack the October low in order to instill confidence in the idea.
Weekly

Chart Prepared by Jamie Saettele, CMT
Automate trades with Mirror Trader
-“Alternating and contracting moves since March probably compose a triangle. The implication is that the USD/CHF range tightens some more before the rate attempts an important directional move. Which way? I don’t know but if it’s higher then the 2006-2008 trendline comes into play and a break above there would be significant (as in going to 1.20+).” USD/CHF has broken out of its triangle but this the rate still faces the mentioned trendline. If the move higher is the ‘real deal’, then the top side of the triangle line should provide support.
BONUS CHART
BTC/USD (Bitcoin)
Weekly
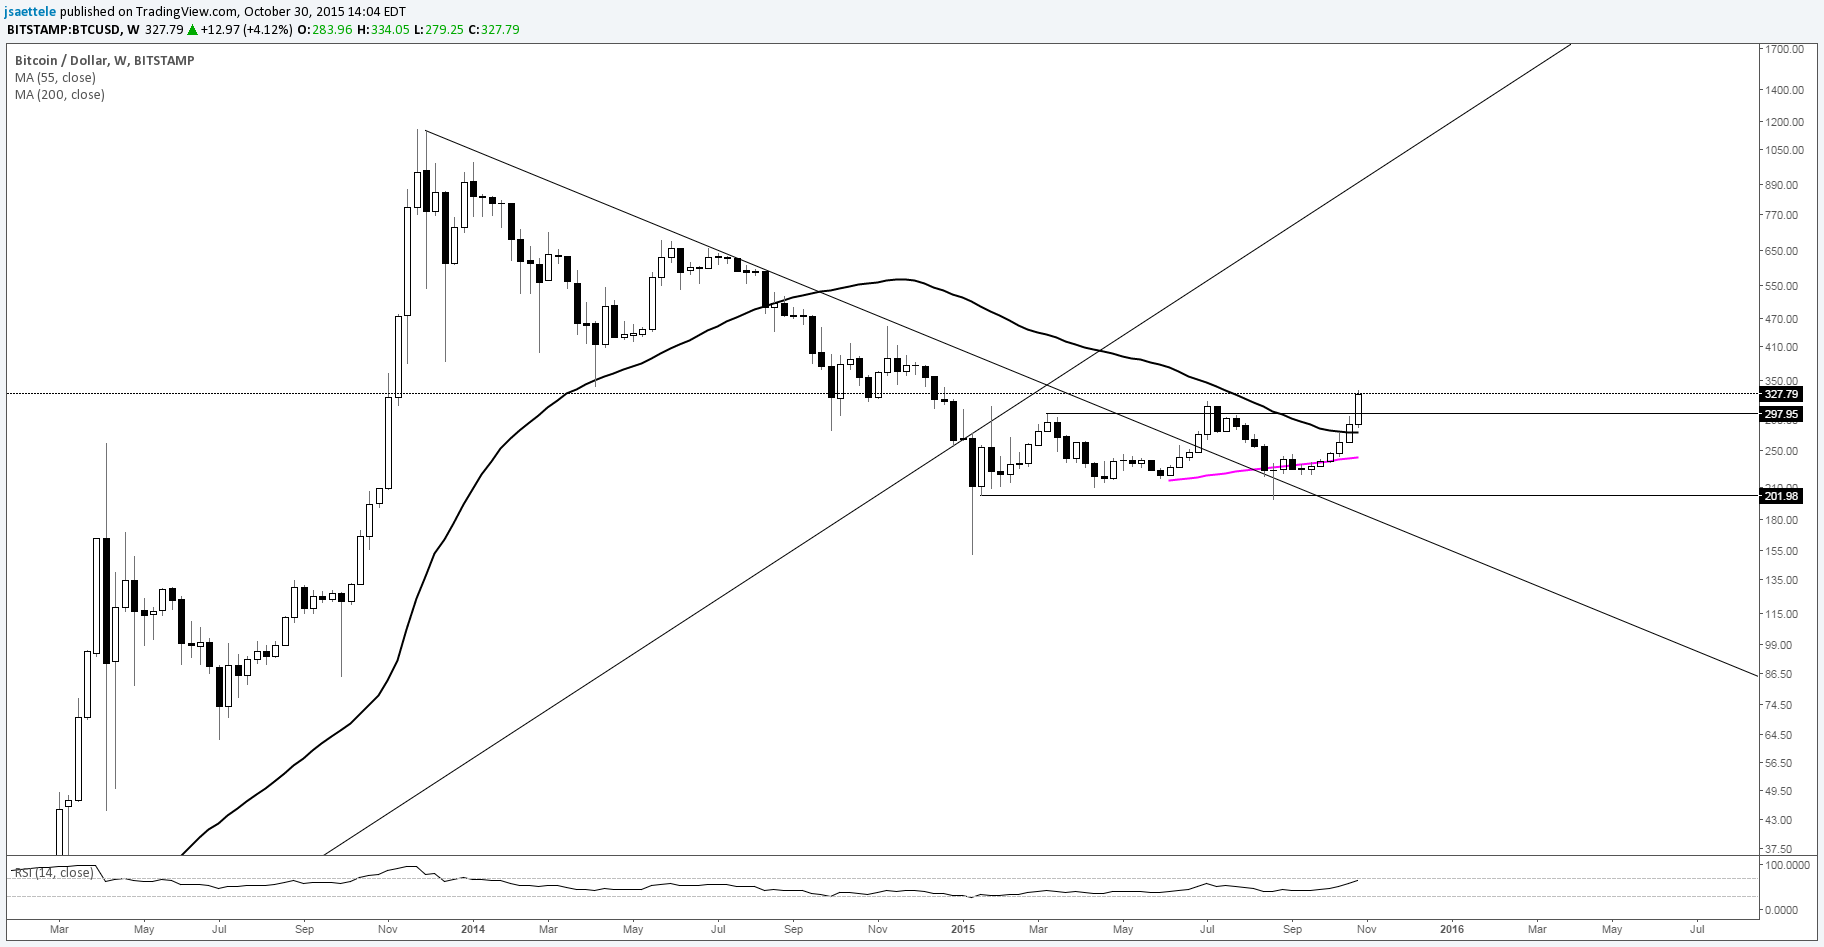
Chart Prepared by Jamie Saettele, CMT
Automate trades with Mirror Trader
-BTC/USD has broken out from a 10 month sideways base. This is bullish until noted otherwise.


