


- EURUSD parallel to 1997
- USDJPY and MAJOR reversals in years that end in 5
- Silver ‘macro’ trendline supports argument for commodities
-- Subscribe to Jamie Saettele's distribution list in order to receive a free report to your inbox several times a week.
--For more analysis and trade setups (including current positions and the ‘watchlist’), visit SB Trade Desk
Weekly

Chart Prepared by Jamie Saettele, CMT
Automate trades with Mirror Trader
-Recent comments remain valid. That is, “Support is estimated in the mid-1.0800s. Resistance is estimated in the mid-1.1400s (May and June high are 1.1435/65). A break on either side would indicate potential for a larger move.” The high this week was a bit above the cited resistance but it did hold.
-Big picture, EUR/USD has worked higher from long term support but failed again at the 55 week average this week. This is the same average that the rally failed at in August…and November 1997. The November 1997 parallel is interesting because that point marked the short covering rally from extreme weakness into the August 1997 low. In 2015, the same average (55 week) has repelled ‘short covering rallies’ following extreme weakness into the March 2015 low. Understand that every major turning point begins as a ‘short covering rally’. The question then is, ‘when does the short covering rally become a rally with legs?’ Well, if current behavior continues to follow that of 1997, then additional range trading is in store (that probably means back to the 1.0800s then higher again). Traction above 1.15 would suggest something bullish is underway.
Weekly
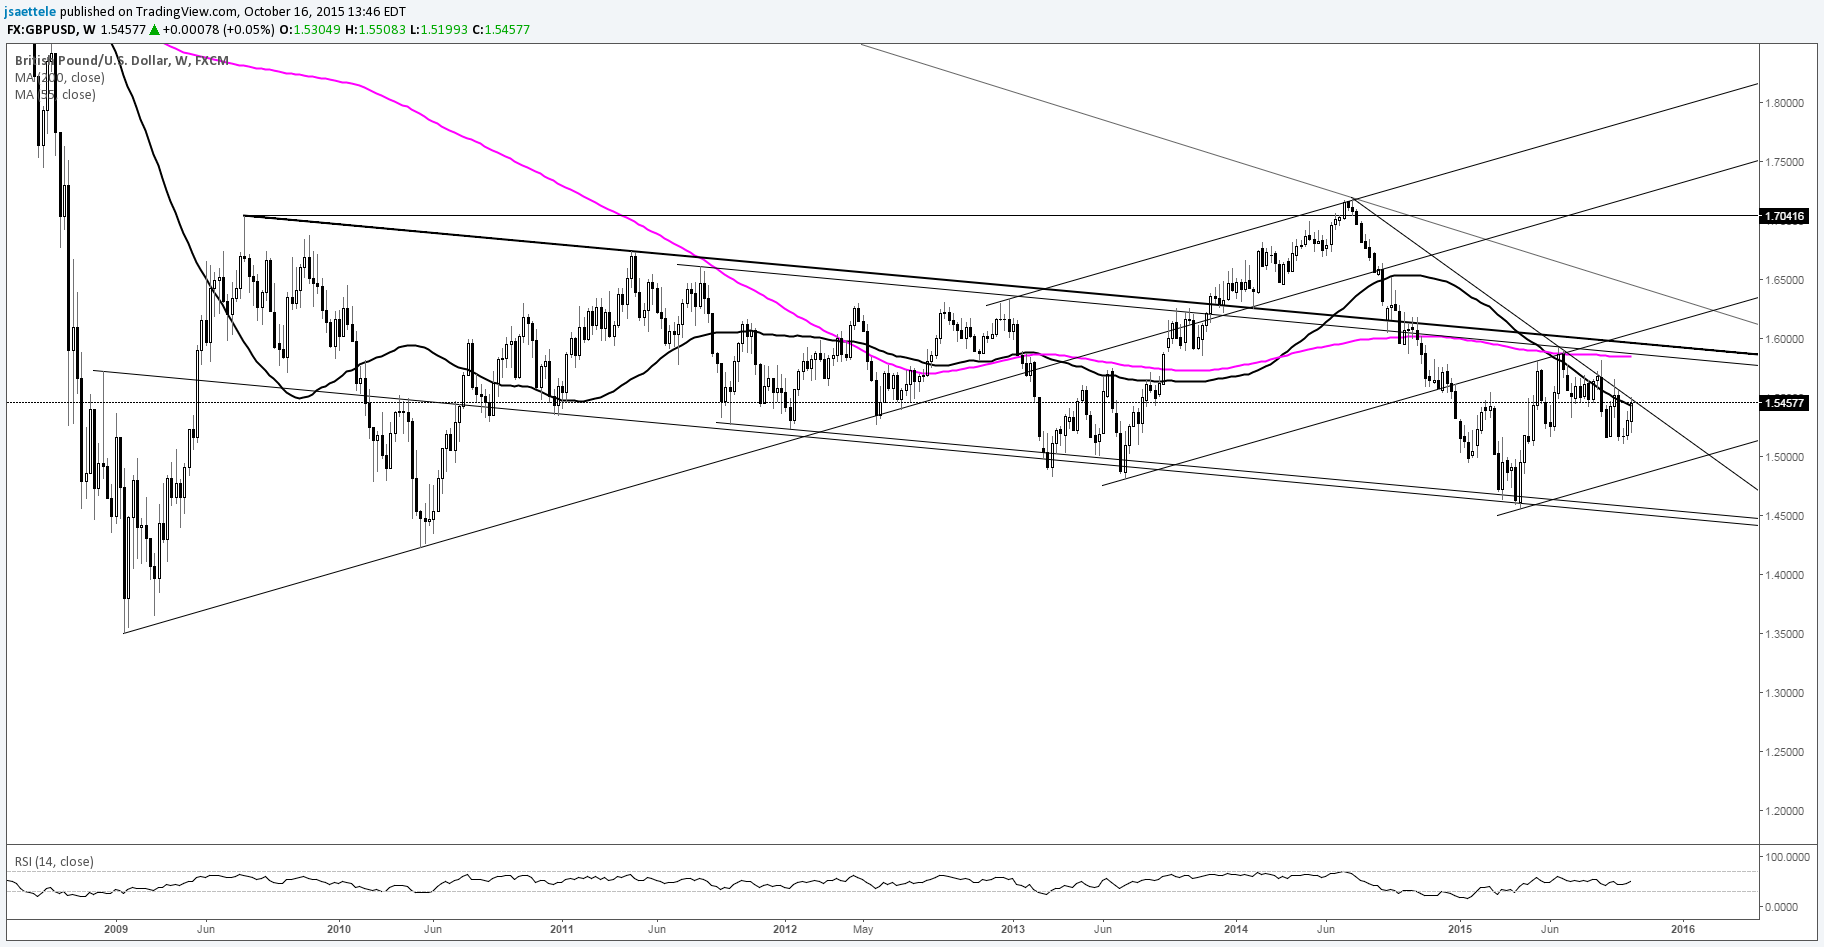
Chart Prepared by Jamie Saettele, CMT
Automate trades with Mirror Trader
-It’s all about the line that extends off of the 2009 and 2011 highs. The long term picture in GBP/USD is bearish due to the behavior at this line and its associated parallels. The rate is at resistance now from the line that extends off of the 2014 and 2015 highs. A push above probably delays anything significantly bearish until near 1.60.
Weekly
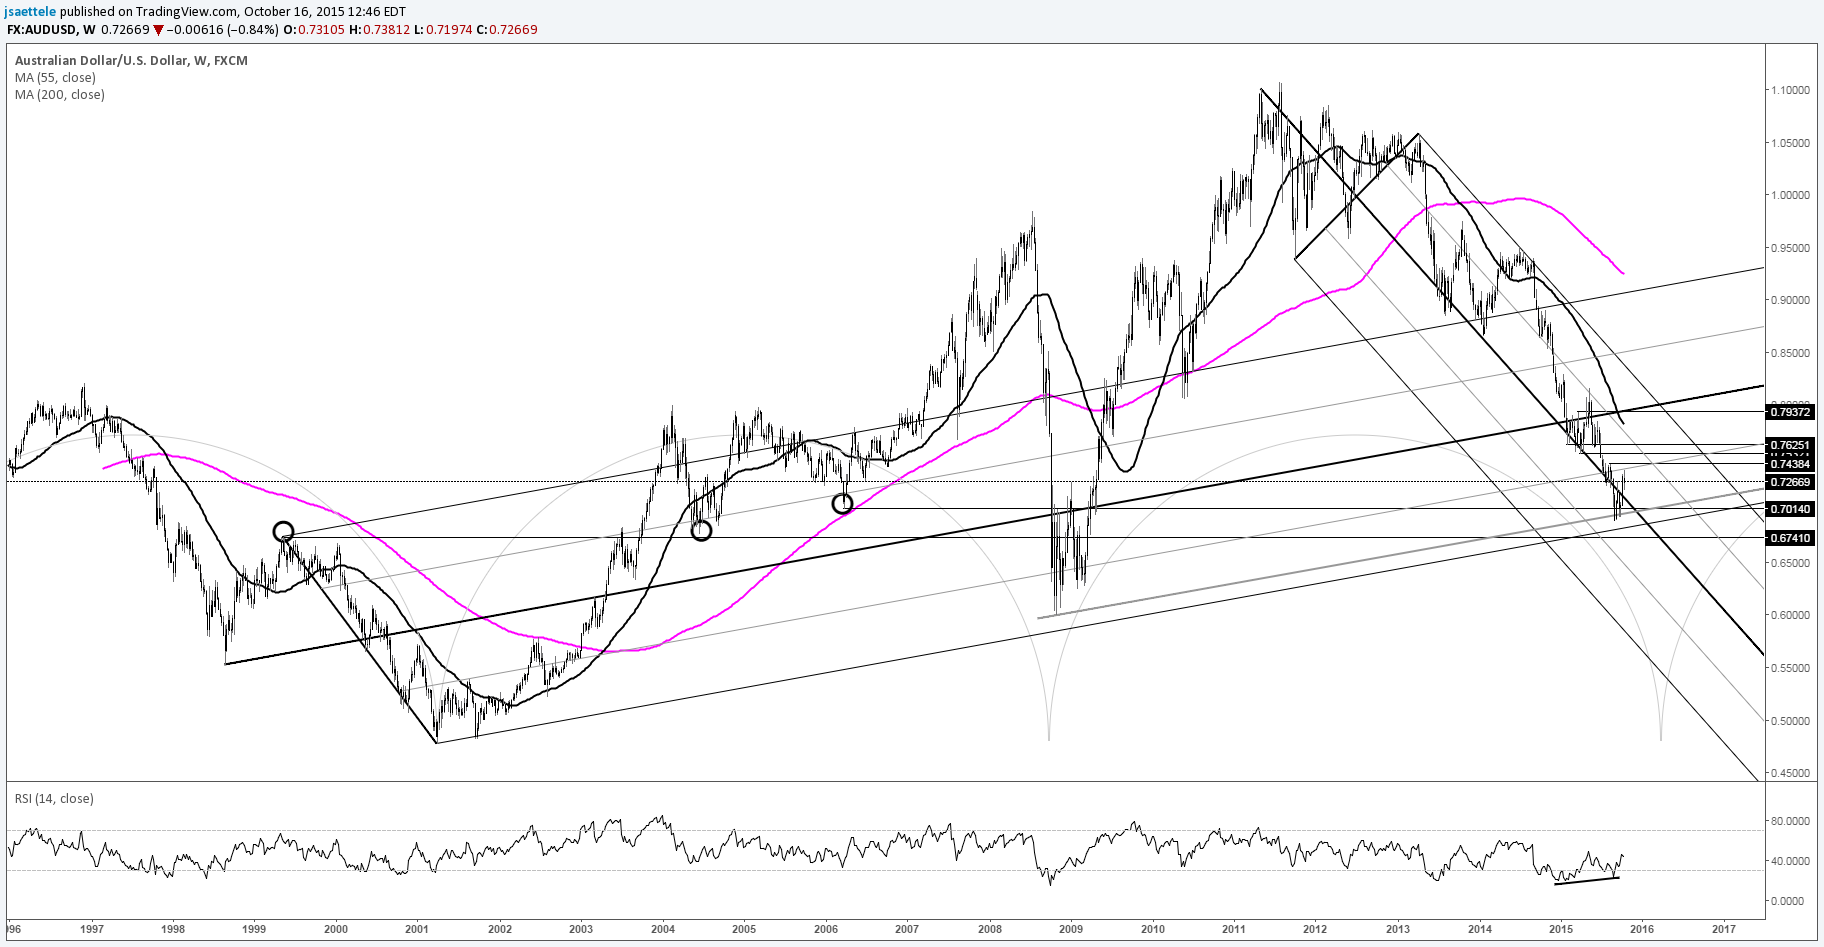
Chart Prepared by Jamie Saettele, CMT
Automate trades with Mirror Trader
-“COT observations and a tweezer bottom candlestick pattern in AUD/USD on the weekly chart indicate reversal risk towards .7440.”
-.7440 could influence for a pullback but ‘decent’ resistance may not reside until .7532-.7625, the zone defined by the February and March lows.
Weekly

Chart Prepared by Jamie Saettele, CMT
Automate trades with Mirror Trader
-NZD/USD triggered a short term double bottom and blew through the target. Given the long term picture, dips should be bought. There probably isn’t solid resistance (as in a place that could cap the bird for at least several weeks or more) until near .70. .70 represents channel resistance and the 200 day average.
USD/JPY
Weekly

Chart Prepared by Jamie Saettele, CMT
Automate trades with Mirror Trader
-“June’s trade produced a monthly key reversal in USD/JPY.” This key reversal didn’t form just anywhere…it formed at the line that connects the 1995 and 2005 lows. That line was support in 2007 and resistance before the 2008 collapse. The time element is interesting of course too (MAJOR turn every 10 years in USDJPY). Bottom line, the key reversal may have signaled a multi-year top in USD/JPY.
Weekly
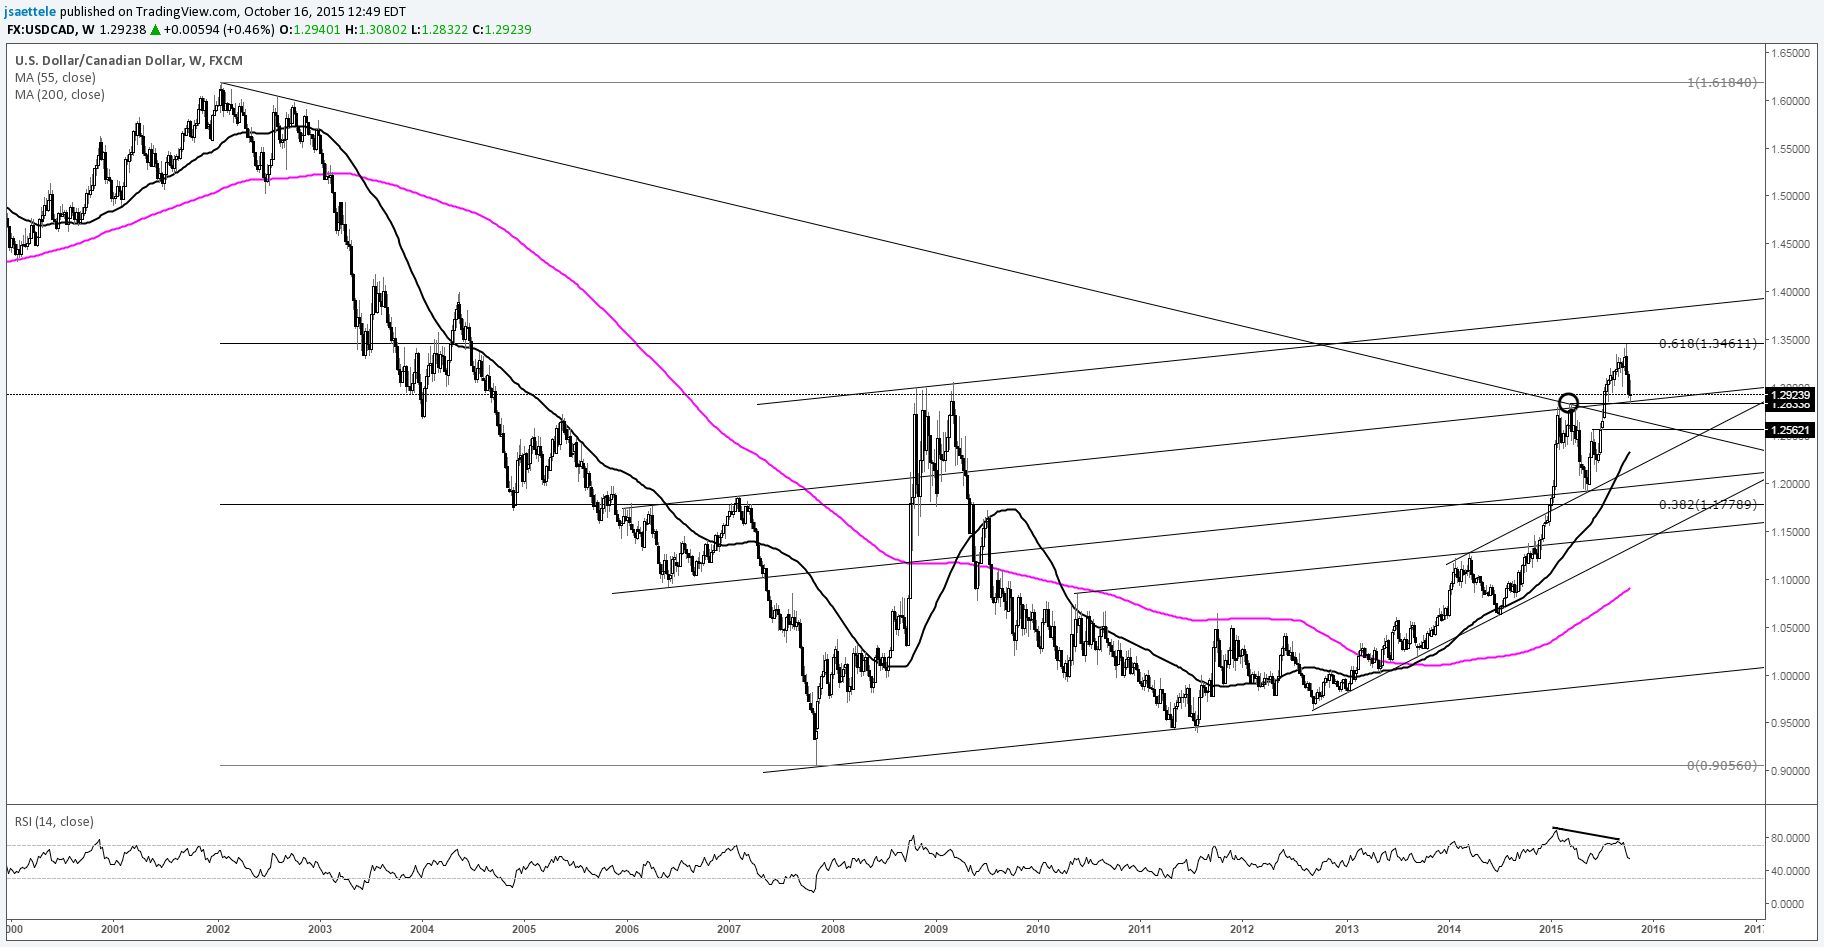
Chart Prepared by Jamie Saettele, CMT
Automate trades with Mirror Trader
-USD/CAD has plummeted from several pips shy of the long term Fibonacci retracement at 1.3462 (61.8% retracement of 2002-2007 decline). The current juncture, defined by the March high at 1.2834 and a slope level near 1.2720, could influence for a bounce but the larger trend has changed (it’s down).
Weekly

Chart Prepared by Jamie Saettele, CMT
Automate trades with Mirror Trader
-Alternating and contracting moves since March probably compose a triangle. The implication is that the USD/CHF range tightens some more before the rate attempts an important directional move. Which way? I don’t know but if it’s higher then the 2006-2008 trendline comes into play and a break above there would be significant (as in going to 1.20+). Near term risk still looks lower towards .9300.
BONUS CHART
Silver
Weekly

Chart Prepared by Jamie Saettele, CMT
Automate trades with Mirror Trader
-The behavior in silver at 12 year trendline support supports the notion that the trend in commodities is up (and down in the USD).


