


- Smallest weekly USDJPY range since August 2014
- AUDUSD line off of 2001 and 2008 lows is near .7100
- NZDUSD Fibonacci confluence worthy of note at .64
-- Subscribe to Jamie Saettele's distribution list in order to receive a free report to your inbox several times a week.
--For more analysis and trade setups (including current positions and the ‘watchlist’), visit SB Trade Desk
Weekly
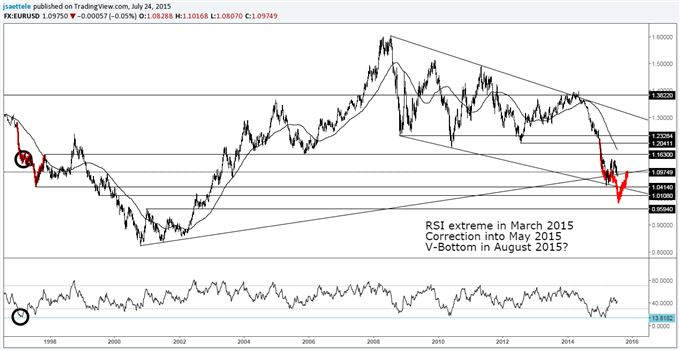
Chart Prepared by Jamie Saettele, CMT
Automate trades with Mirror Trader
-“The tightening range since the May high could compose a triangle within a larger advance from the March low.” A broader range does of course remain possible but with EURUSD breaking support this week, one must consider a more immediate bearish alternative. Comparisons with 1997 (pre euro trading but a calculated value is plotted) price behavior are striking. In both 1997 and 2015, the rate plunged out of the gate into March. Weekly RSI registered extremes the weeks of 3/3/97 and 3/9/15. Ensuing corrections stretched into the weeks of 5/19/97 and 5/11/15. In 1997, EURUSD dropped sharply into the week of 8/4 before reversing sharply to return to its May high. If something similar happens here, then EURUSD would trade down to about .9840 in August before trading back to 1.1450+.
-Near term, the rate has traded into resistance (old support).
Weekly
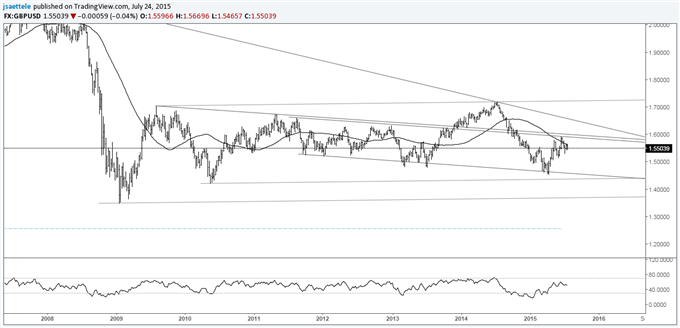
Chart Prepared by Jamie Saettele, CMT
Automate trades with Mirror Trader
-“GBPUSD has broken above its 52 week average for the first time since September 2013. There are hurdles to clear from slope resistance (on various time frames) up to about 1.60. As such, a period of consolidation below 1.60 may be in store before an attempt on 1.64+ (2 equal legs from the April low).”
-The ‘period of consolidation’ turned into a 6 figure decline from well-defined slope resistance. The rate has turned down from below the well-defined 1.5700. You might see support near 1.5359. A break below there would open up 1.4950-1.5100.
Weekly
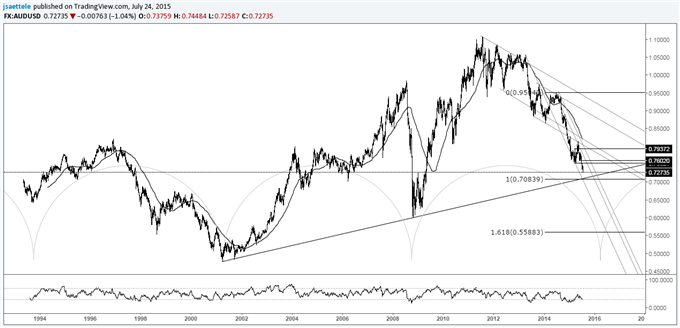
Chart Prepared by Jamie Saettele, CMT
Automate trades with Mirror Trader
-“A slope confluence pinpointed the May high, which keeps the broader trend pointed lower. A long term level to be aware of in AUDUSD is the line that connects the 2001 and 2008 lows, which is near .7100. Be aware that the range that has been underway since April could persist for months and morph into a triangle or flat pattern.”
-“The immediate picture is bearish. Range expansion objectives yield .7143 and .6902.” The former level is joined by the trendline that extends off of the 2001 and 2008 lows. The decline from the 2011 high would consist of 2 equal legs (subdivided with the 2013 low and 2014 high) at .7084.
NZD/USD
Weekly
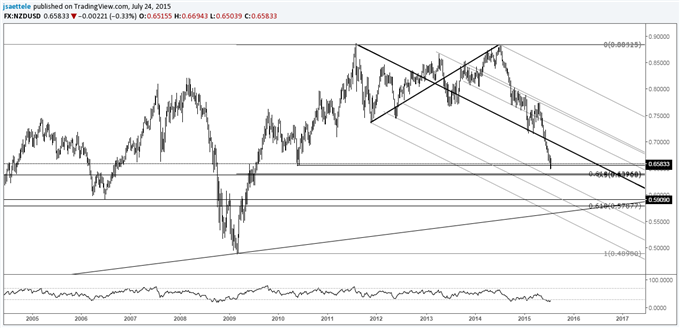
Chart Prepared by Jamie Saettele, CMT
Automate trades with Mirror Trader
-“One can’t help but notice that an epic double top is possible with a target of .5898. That would trigger on a drop below .7370.”
-“A bearish wedge pattern has formed and yields an objective of .6607.” Look towards the mentioned objectives (.6607 and .5898). The wedge objective has been reached as has the 2010 low at .6560. The next levels to be aware of are .64 (61.8% retracement of the 2009-2011 rally and 50% retracement of the 2000-2011 rally) and .60 (long term double top target).
USD/JPY
Weekly
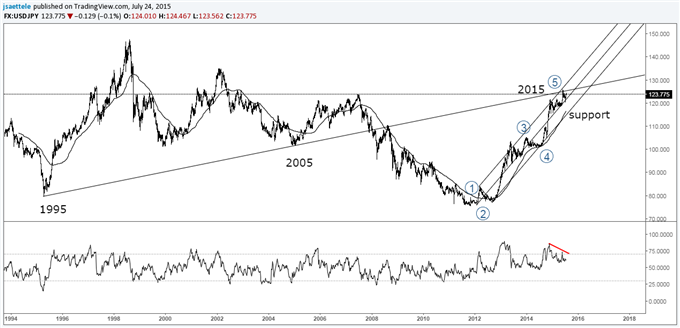
Chart Prepared by Jamie Saettele, CMT
Automate trades with Mirror Trader
-“A USDJPY breakout from the 6 month coil would open up 123.16-124.13 (high close from June 2007 and 2007 high). A measured objective from the pattern yields 125.72 and 128.12.”
-“USDJPY ended up trading to 125.85 (the mentioned 125.72 was the December range x .618 + the December high…basically a Fibonacci range expansion). Failure at long term uptrend resistance indicates potential for an important top to form. As I type, there are 2 days left in June and USDJPY is little changed for the month (month open is 124.10). In other words, a monthly doji could form…at a 20 year trendline (former support…may provide resistance now)!”
-“June’s trade produced a monthly key reversal in USDJPY.” USDJPY has snapped back but a break above the long term resistance confluence (uptrend resistance and the line from the 1995 and 2005 highs) is still needed in order to minimize downside risk.
Weekly
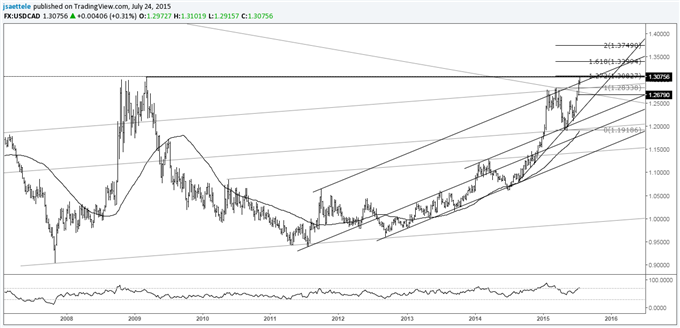
Chart Prepared by Jamie Saettele, CMT
Automate trades with Mirror Trader
-“A 10 month trendline has supported USDCAD on recent dips. The development indicates potential for resumption of the broader bull move.”
-“USDCAD has broken out. 11 year highs aren’t far off. The 2009 high is at 1.3062 (just below the 127.2% extension of the March-May range, which is at 1.3083).” 11 year highs have been reached. The next measured level is the 161.8% extension of the March-May range at 1.3399. The March high at 1.2834 is now support.
Weekly
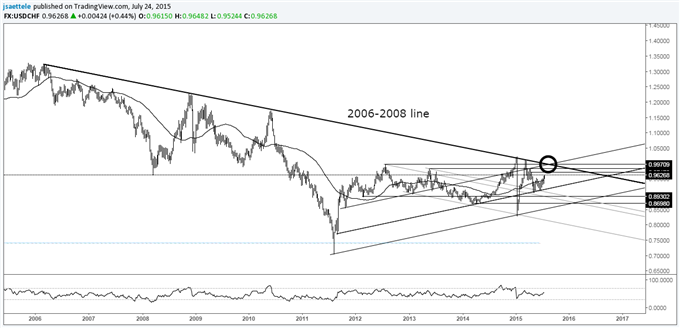
Chart Prepared by Jamie Saettele, CMT
Automate trades with Mirror Trader
-“The break above near term slope indicates a short term behavior change. .9250 needs to hold in order to look higher. Watch for resistance near .9600 (50% from the March high at .9599 and 2 equal legs from the May low at .9621).”
-“USDCHF dropped into .9250 this week (low was .9242) and promptly rocketed to .9500. Focus is higher as long as price is above .9242. The mentioned .9600 may provide resistance. Near term support is estimated at .9330. A break above .9600 would target .9913 (Fibonacci).” .9330 held as support on 7/10 and the rate has reached initial resistance at .96. Look towards .9720 (61.8% retracement of decline from March high and 4/23 high).


